ABSTRACT
This paper addresses the data acquisition system designed in order to gather flight test data for two different aircraft for the AERO flight test class at Cal Poly San Luis Obispo. It summarizes the system, data acquisition devices, methods used, data comparison and validation, and step-by-step procedures to properly gather data for reduction and analysis. Also, the paper gives examples of initial data reduction processes and analysis. It provides a simple MATLAB code that allows data to be extracted from a handheld GPS as well as a procedure to gather data from a black box recorder in Cal Poly’s RV 7 aircraft. It also explains the use of Google Earth in presenting flight data. Lastly, it investigates the use of Smartphone sensors to gather data and explains why it is not viable solution.
DATA ACQUISITION DEVICES AND INTEGRATION
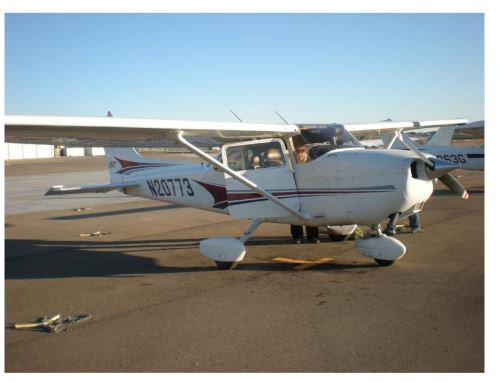
Figure 1. Cessna 172 aircraft
Two different types of aircraft are used while collecting flight test data. The first aircraft is a Cessna 172 shown in Fig. 1. Since the Cessna 172 contains all analog instruments, a GPS receiver discussed later is used to collect flight test data. The GPS receiver is mounted to the yoke of the Cessna 172 to allow hands free operation. The procedure on setting up the mount and GPS in the Cessna 172 is shown in Appendix A under the Cessna 172 aircraft section.

Figure 3. Garmin GPSMAP 495
The GPS used is Aviation quality Garmin GPS MAP 495 as shown in Fig. 3. The 12 channel GPS receiver is able to track locations over a period of time. This feature allows one the ability to gather flight test data, extract it from the device, and subsequently save it on to a computer. The GPS has a removable antenna, and a USB cable that allows the device to interface with the computer.
POST FLIGHT DATA EXTRACTION METHODS
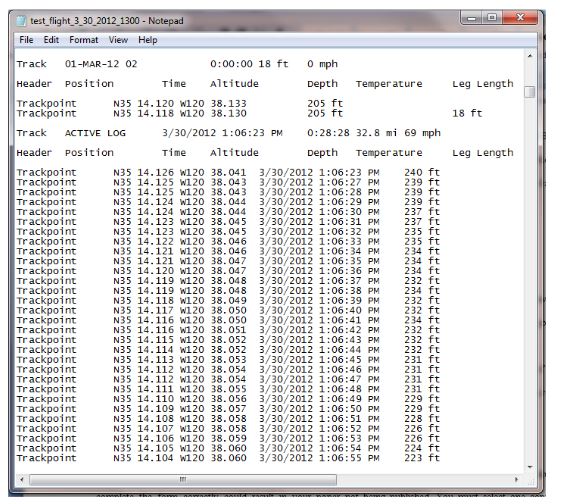
Figure 6. Garmin GPSMAP 495 example text file
One of the main challenges in extracting data from the GPSMAP 495 is organizing the data into a readable and easily presentable format. MATLAB is an excellent tool that is able to not only post-process the data, but also has the ability to filter through complicated text file formats. A MATLAB function was developed to eliminate this problem of a non-standard text file that contains many characters and header lines. Figure 6 shows an example of the Garmin GPSMAP output text.
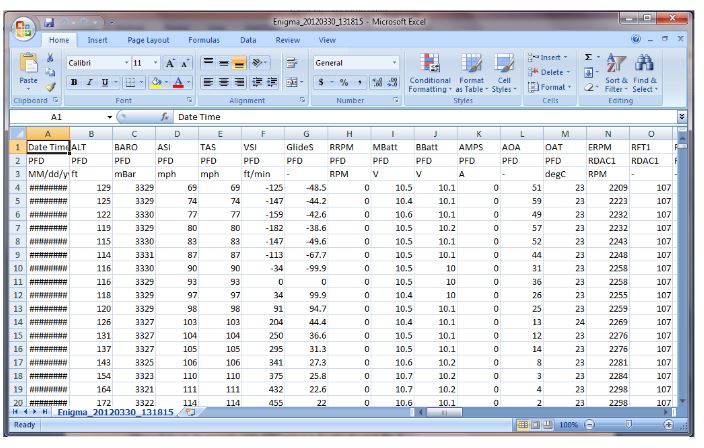
Figure 8. EFIS output example of the CSV file in Excel
An example of the EFIS output in Excel is shown in Fig. 8. Additionally, MATLAB can be used as well. MATLAB recognizes the file format and can place the data in a large matrix of values. It is done by using the “importdata” function and easy to use import wizard Graphical User Interface (GUI) that allows the user to select options pertaining to how the data is organized.
FLIGHT TEST RESULTS
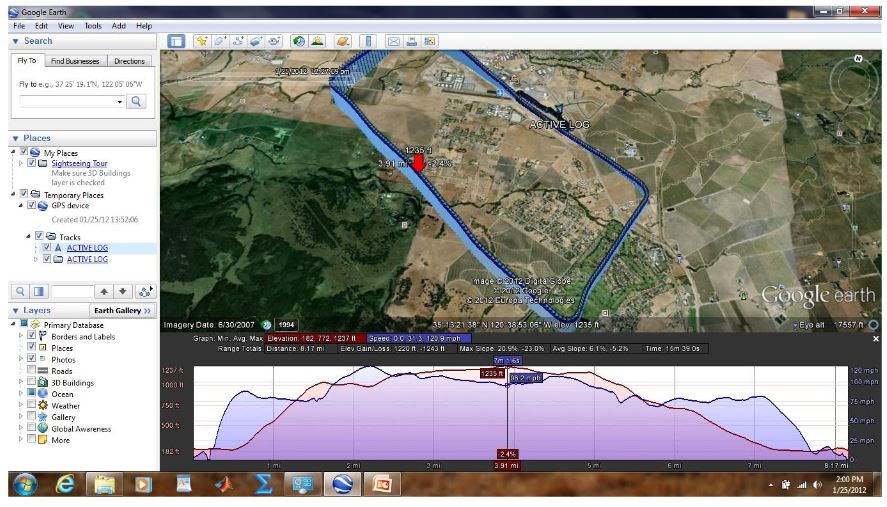
Figure 10. Google Earth presentation of RV7 flight test while flying one traffic pattern
The first flight test conducted in the RV 7 was a simple taxi and takeoff and land while remaining in the pattern. The GPSMAP 495 and the Smart phone sensors were used for this flight. First, the data from the Garmin GPS is presented using Google Earth and is shown in Fig.10. An elevation profile can be created and shown in Google Earth. This allows the user to investigate the profile to insure that no outliers exist that may have been caused by poor GPS signal. Speed and altitude information are displayed in the elevation profile in Google Earth.
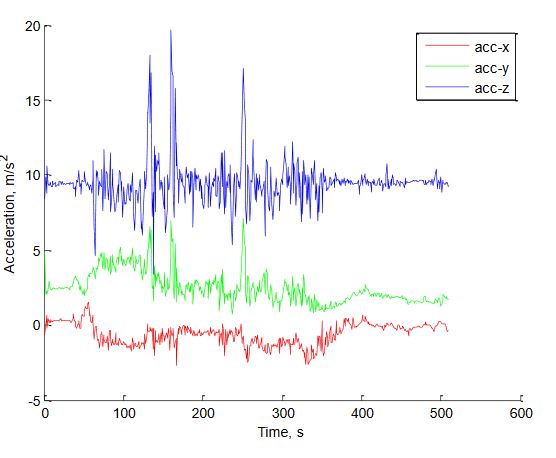
Figure 14. Accelerometer Data from flight test on Smartphone Device
The results of the accelerometer data from the same flight are shown in Fig. 14. The results show extreme noisy data that is unacceptable. The worst noise occurs in the vertical acceleration. Although the average of the vertical acceleration occurs around 10 m/s and is expected since it was mostly a 1G flight, the sensor was not able to gain steady measurements within the flight.
CONCLUSION
Although the results from the flight test data is limited to the 1 Hz data rate, the information gained from using this system allows users to obtain data that is not available through manual handwritten methods. This system eases the extent of handwritten data within the aircraft and during the flight tests because of the automation of this flight recording data acquisition system.
Data is not longer interpreted through human error which was all that was available initially. The data gained is valid and follows the flight quite well with the exception of the Smartphone device. The Garmin GPSMAP 495 is a versatile tool to track and provides adequate results to further reduce the data and gain ground acceleration and vertical speed. The RV 7’s EFIS provides much more data that the handheld GPS alone and is recommended for use if the flight test requires attitude of the aircraft and air data.
Although the Smartphone device provides much higher data rate than the Garmin GPS or the EFIS, the internal hardware is not up to par with this application. In conclusion, the Smartphone is not recommended for this application. As an improvement, a more sophisticated recording system can be acquired to improve the 1 Hz limitation. Future suggestions would continue with this work and provide data interpolation and filtering to get differentiable values.
Source: California Polytechnic State University
Author: Christopher Michael Gocha
>> Antenna Projects using Matlab
>> Smart Antenna Design Final Year Projects for Students