ABSTRACT
The purpose of this project is to create a system that automatically converts monophonic music into its MIDI equivalent. Automatic pitch recognition allows for numerous commercial applications, including automatic transcription and digital storage of live performances. It is also desirable to be able to take an audio signal as an input and create a MIDI equivalent score because the MIDI information can be used to replace the original audio signal sounds with any sound the user would like. For example, if a piano composition is entered into the system, the resulting MIDI out could be used to trigger guitar samples.
The main deliverable for this project is a DSP evaluation board that takes a monophonic analog audio signal (ex. a recorder or someone’s voice creating one pitch at a time), analyzes the signal for its fundamental frequency, and output s MIDI data that represents the pitch and timing information contained in the audio signal all in real time.
BACKGROUND

Figure 1: Fundamental Frequency Value Range in Western Music using Equal Temperament Tuning (Feilding)
Equal-temperament is a system of tuning (allotting note names to frequencies) where each pair of adjacent pitches has the same frequency ratio. This causes each octave (where the distance between two pitches an octave apart is defined as twice the frequency of the lower pitch) to be comprised of 12 equally spaced pitches. Figure 1 shows how equal temperament splits up each octave.
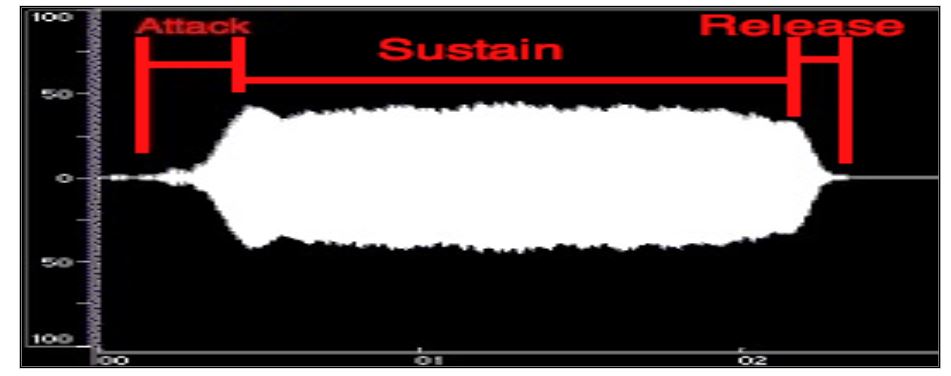
Figure 3: A time domain representation of a note played by a flute (Fitz)
A time domain representation of a pitch played by a flute is shown in figure 3 below. Notice that the note changes with time in an envelope that can be characterized as having an attack, sustain, and release portion. The significance of these portions in terms of pitch identification will be discussed later.
REQUIREMENTS
1. The system will use a microphone (dynamic or condenser) to capture an audio signal (of any length of time) coming from a recorder in real time.
2. An XLR cable from the microphone will be interfaced with a 3.5mm jack through an adapter. The signal from the microphone will be fed into the ADC (which must operate between 10 and 24 bits of dynamic range).
3. The system will detect what pitch is being played (fundamental frequency of incoming audio) and at what time using time domain analysis techniques and/or frequency domain analysis techniques.
4. The analysis will occur in real time. Calculations should be optimized and only run for as long as needed to identify a pitch.
DESIGN APPROACHES
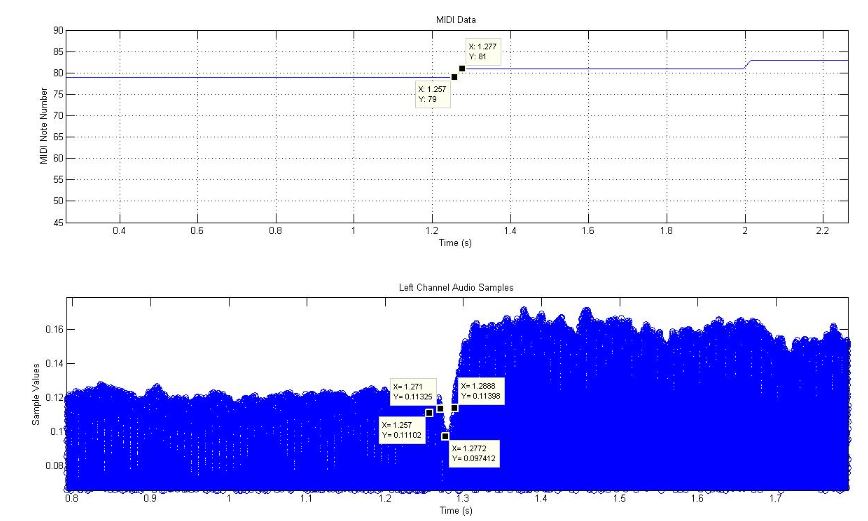
Figure 7: Results for the timing test for the FFT to First Peak Search algorithm
To verify that the note timing information could accurately be deciphered, the following plot, figure 7, was created. The bottom figure plots the time domain waveform (where the note actually changed), and the top plot shows where the pitch recognition algorithm detected a change of pitch. The labels describe when our algorithm discovered the notes to change (the time of the change in the MIDI note), and where the notes actually changed (defined by a-3 dB drop in the amplitude of the audio signal).
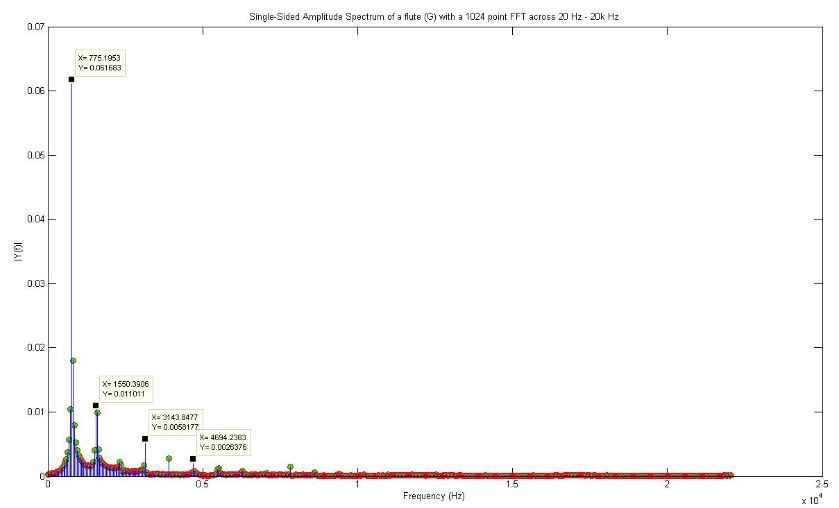
Figure 8: FFT of a recorder playing Eb, and the results of the peack search
To verify that the algorithm could correctly detect which pitches were present in the incoming audio signal, we used a recording of a recorder playing a Eb (MIDI note 79, fundamental frequency of 783.99 Hz). Using a 1024 point FFT, MATLAB found the peak to be 775 Hz (as can be seen in Figure 8), which is an error of 1.14%.
PROJECT DESIGN
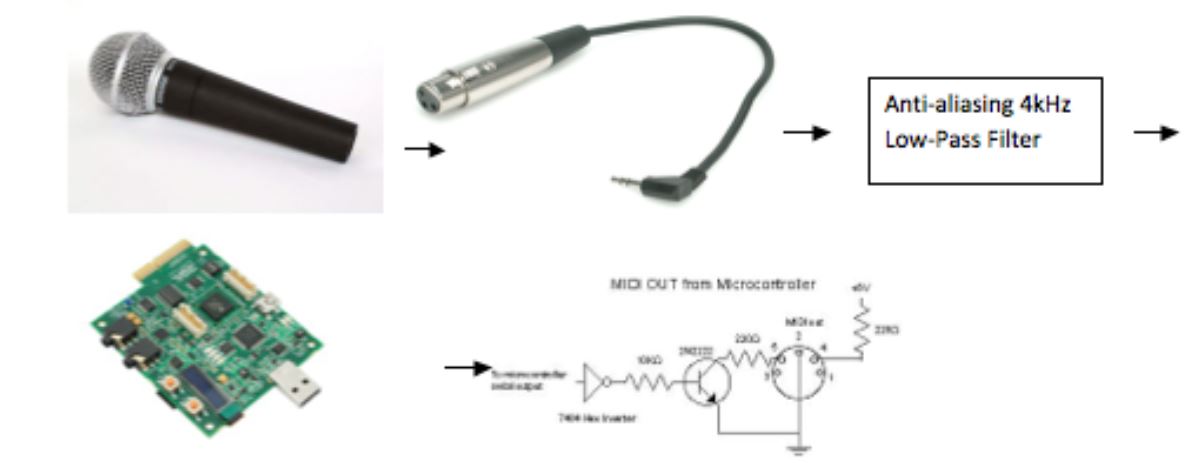
Figure 13 : A high level representational diagram for the system
Figure 13 describes a summary of the system. The output stage is a standard MIDI connector which the user can use with any MIDI device. The two inverters and the resistor act as an impedance buffer and bring the voltage level to the appropriate range for MIDI.
PHYSICAL CONSTRUCTION AND INTEGRATION
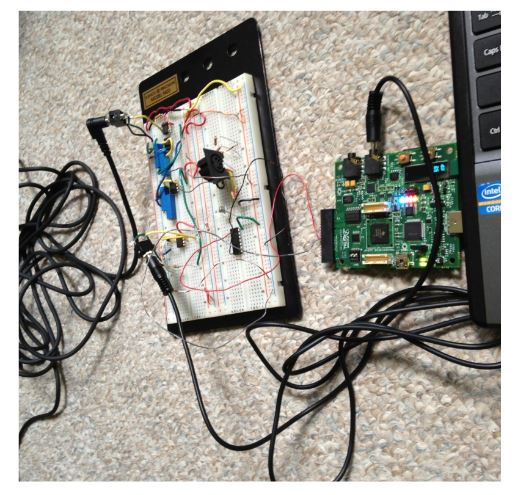
Figure 16: Physical Implementation. Top left audio jack is microphone input. Signal runs through filter and is input to audio jack on DSP boar
There is no physical enclosure needed for the device. The DSP evaluation board plugs into a computer via a USB 2.0 port. The sound source is connected to the anti-aliasing filter using a 3.5mm jack. The output of the filter connects to the DSP via a 3.5mm cable. The output MIDI signal is connected to the MIDI interfacing circuit using jumper wire. The output of the MID interfacing circuit is connected to a standard 5 pin DIN connector.
INTEGRATED SYSTEM TESTS AND RESULTS
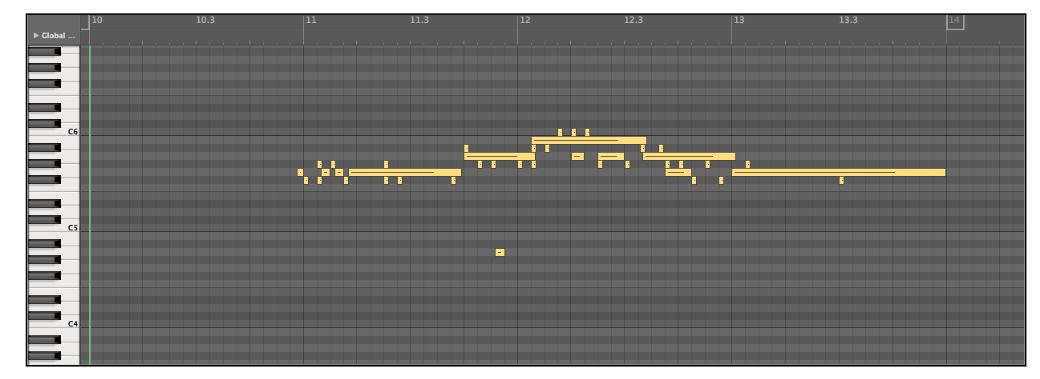
Figure 18: Actual experimental results of the third test trial. The longer sustained notes are correct, but the small MIDI notes are incorrect pitches being identified
The problem with our peak detection system is that the DSP locates peaks in the signal energy in frequency bins surrounding the frequency bin in which we expect the peak to appear. We tested this by inputting a pure 1000 Hz sinusoid, and found that the DSP found peaks anywhere from 970 to 1040 Hz on average, and sometimes even found peaks hundreds of Hertz away from 1000 Hz.
CONCLUSIONS
The original specifications were not met entirely. The functional requirements of the system, however, were met. The proper inputs and outputs were functional for the format that we specified. The performance specifications were not met. Since the system could not properly identify the fundamental frequency even when a pure sinusoid was input, it was doubtful that the system could correctly identify the fundamental when a more complicated signal (a recorder) was input.
Indeed, the system could not consistently identify the correct pitch recorder was played into the microphone. Peaks in the energy were clearly found in frequency bins around the frequency bin in which we expected the peak to appear. See figure 17 for a tabulated summary of the error in our trials involving the pre-recorded flute. Unfortunately because the TMS320C5535 eZdsp board had just been released, documentation, support and resources for using the chip and its peripherals were scarce.
Existing documentation often had errors, and contradictions. The majority of this project was spent understanding how to get the chip to correctly communicate with all of the peripherals (I2C, I2S, the ADC, DMA, and UART). Once the chip was successfully receiving audio data, processing it, and transmitting MIDI data, there was little time to troubleshoot and resolve the large margin of error we were seeing.
Source: California Polytechnic State University
Authors: Nathan Zorndorf | Kristine Carreon
>> 50+ Matlab projects for Digital Image Processing for Final Year Students
>> Matlab Projects Fingerprint Recognition and Face detection for Engineering Students
>> More Matlab Projects on Audio Processing for Final Year Students
>> More Matlab DSP Project Ideas for Final Year Students