ABSTRACT
A flight data acquisition system was developed to aid unmanned vehicle designers in verifying the vehicle’s design performance. The system is reconfigurable and allows the designer to choose the correct combination of complexity, risk, and cost for a given flight test. The designer can also reconfigure the system to meet packaging and integration requirements. System functionality, repeatbility, and accuracy was validated by collecting data during multiple flights of a radio-controlled aircraft. Future work includes sensor fusion, thrust prediction methods, stability and control derivative estimation, and growing Cal Poly’s small-scale component aerodynamic database.
METHOD

Figure 2.1: NED Frame of Reference
Any error in a measured state will decrease the accuracy of the drag measurement, and the accuracy of a given drag measurement can be no better than the worst state measurement error. In-flight thrust is difficult to measure accurately, so a folding propeller will be used, and the motor will be turned off during data acquisition. This will allow the propeller to fold back, eliminating most of the wind-mill drag associated with a stalled propeller.
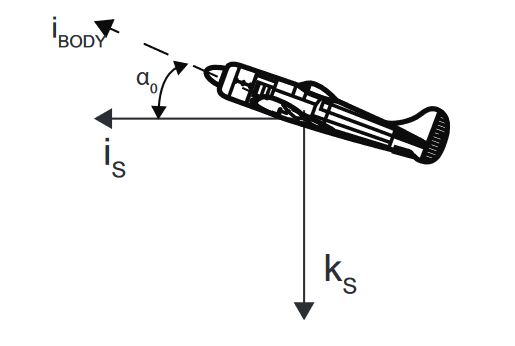
Figure 2.3: Stability Axes Definition
This initial angle-of-attack is defined at the beginning of a test maneuver and is then set for the remainder of the test, making it a body-fixed coordinate system. This system assumes no initial sideslip angle. In Figure 2.3, only the stability i vector is shown, for clarity.
Drag Meta-Modeling
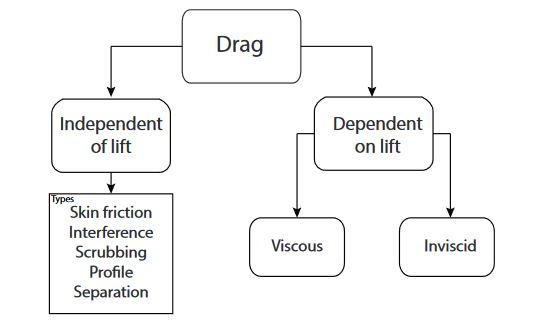
Figure 3.1: Drag Contribution Types
Drag force comes from many different contributions, but can be split into drag that is independent of lift, and drag that is due to lift. The summation of all sources of drag that are independent of lift is often called minimum drag, and is roughly constant, for a given Reynold’s number and Mach number. The drag due to lift can be split into viscous drag-due-to-lift and inviscid drag-due-to-lift.
ERROR ANALYSIS
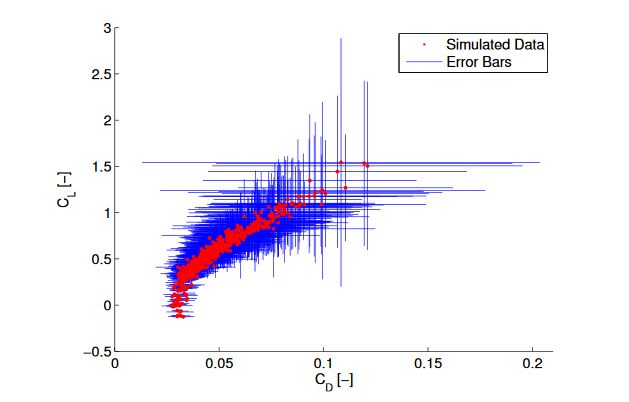
Figure 4.1: Heteroskedastic Error from Simulated Flight
This function was used whenever an estimate of point error was required, such as for the variance matrix PK used in the Kalman filters utilized for state estimation. A plot of simulated flight data is shown in Figure 4.1, where the error bounds shown were calculated using the error estimate function. Note that this figure also shows the heteroskedastic nature of the error.
SIMULATION
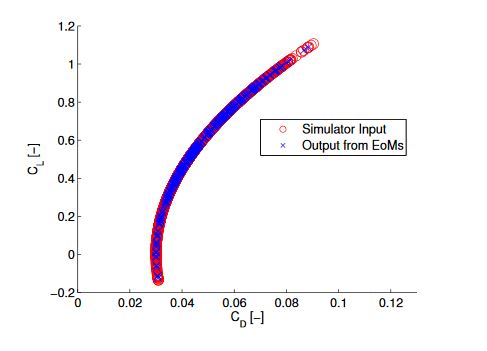
Figure 5.1: Data Analysis Verification
After adequate data had been taken, the data was analyzed without adding simulated sensor noise. The results in Figure 5.1 show that the equations of motion used in the data analysis functions properly calculate the coefficients being passed into the system.
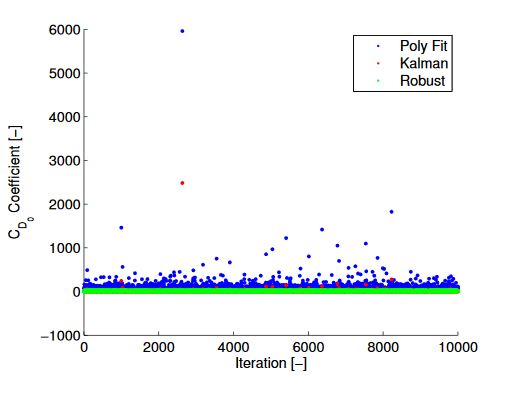
Figure 5.3: CD0Monte Carlo Simulation
Error with a standard deviation equal to those reported by the manufacturer was added to clean simulated flight data, and the percent error in each coefficient was saved. This process was repeated 10,000 times, and the results are shown in Figures 5.3-5.5.
HARDWARE
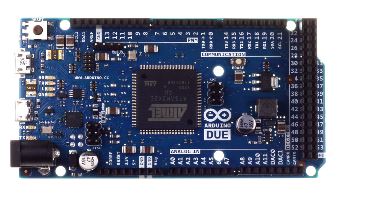
Figure 6.1: Arduino Due Flight Computer
The flight computer chosen was an Arduino Due. This board has a 32-bit ARM processor, 54 digital I/O pins, 12 analog input pins, and 2 analog output pins. The main driver in the decision to use an Arduino-based platform was the vast support community, which allows quicker software development. The Arduino also offers a package that integrates well into most of the available airframes, and the stackable header pins allowed for easy integration with other boards.
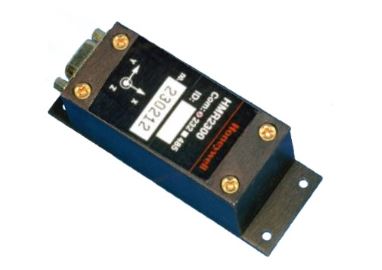
Figure 6.5: Honeywell HMR-2300 3-D Magnetometer
Two separate magnetometers were used for separate purposes. A Honeywell HMR-2300 3-D magnetometer, shown in Figure 6.5, is the main magnetometer. It is used when extremely accurate heading information is needed, or when GPS course is unavailable, such as during extremely slow or vertical flight.
RESULTS
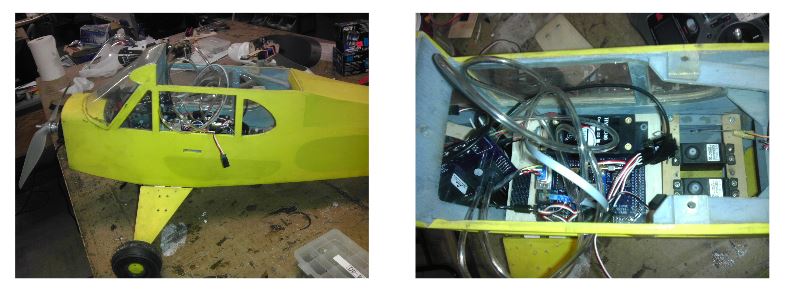
Figure 7.1: System Integration into 0.60-size R/C Piper Cub
Flight testing was completed at Cal Poly’s Education Flight Range. Each flight test included multiple stalls and high speed dives, so that as much of the flight envelope was covered as possible. More information on specific flight test procedures is available in Appendices A and D.
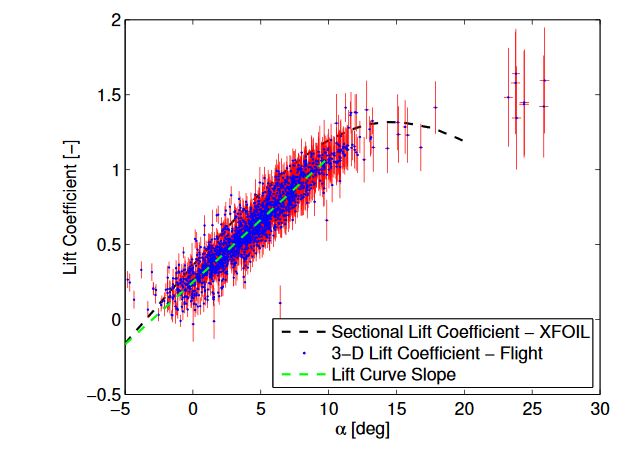
Figure 7.4: Lift Curve from Flight Test
However, the approximate maximum lift coefficient in Figure 7.4 matches well with the estimate of the maximum lift coefficient found using XFOIL. The stall angle of attack appears to be accurate for the set of semi-continuous data.
SUMMARY
A flight data computer capable of measuring a small UAVs aerodynamic forces was developed. The system utilizes an Arduino Due as the main flight computer, and integrates both sensors necessary for aerodynamic force calculation, and additional sensors that provide interesting information about the vehicle. The system was manufactured in a PCB form to keep reliability high, integrated into a 0.60-size electric Piper Cub, and validated for accuracy and repeatability. The flight tests showed a CD0 accuracy of 6% of the trailing cone’s estimated drag coefficient, and a zero lift angle of attack accuracy of less than 1% error compared to that estimated by XFOIL.
The lift curve slope estimated from combining flight data with XFOIL analysis was, on average, accurate to 17%. Future work could include a sensor fusion algorithm, which would be developed to combine inertial sensors with the air data system and other available sensors in a manner similar to other current research, thus giving full situational awareness to the UAS. This situational awareness could allow stability and control derivative estimation, which the aircraft designer could use to size tail and control surfaces.
In-flight dynamic thrust estimation is also possible, and could be validate against propeller data available from the University of Illinois at Urbana-Champagne. Of most interest to the other, future work could utilize this thesis to estimate the lift and drag impact of difference vehicle configurations to quantitatively make trade studies early in the conceptual design phase. This could include configuration level trades, or subsystem level (no landing gear, normal gear, gear with wheel pants, retractable gear,etc.) trade studies, which could dramatically increase the current small scale aerodynamic knowledge base at Cal Poly.
Source: California Polytechnic State University
Author: Adam T. Chase