ABSTRACT
Tremor is a neuro degenerative disease causing involuntary muscle movements in human limbs. There are many types of tremor that are caused due to the damage of nerve cells that surrounds thalamus of the front brain chamber. It is hard to distinguish or classify the tremors as there are many reasons behind the formation of specific category, so every tremor type is named behind its frequency type. Proper medication for the cure by physician is possible only when the disease is identified.
Because of the argument given in the above paragraph, there is a need of a device or a technique to analyze the tremor and for extracting the parameters associated with the signal. These extracted parameters can be used to classify the tremor for onward identification of the disease.
There are various diagnostic and treatment monitoring equipment are available for many neuro-muscular diseases. This thesis is concerned with the tremor analysis for the purpose of recognizing certain other neurological disorders. A recording and analysis system for human’s tremor is developed.
The analysis was performed based on frequency and amplitude parameters of the tremor. The Fast Fourier Transform (FFT) and higher order spectra were used to extract frequency parameters (e.g., peak amplitude, fundamental frequency of tremor, etc). In order to diagnose subjects’ condition, classification was implemented by statistical significant tests (t‐test).
THEORY
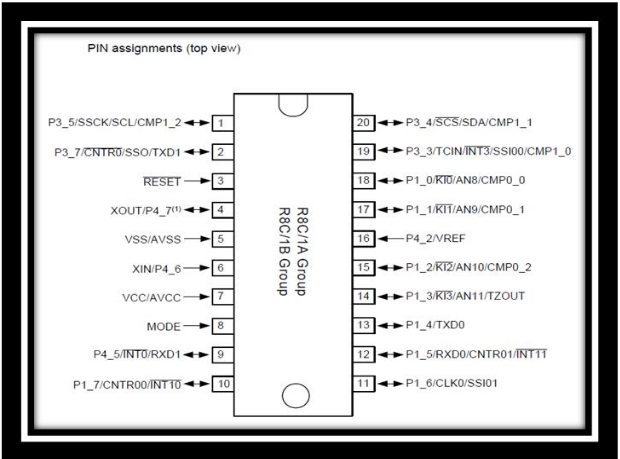
Figure 2.3 Pin Diagram of R8C/1B MCU (10)
The microcontroller has 20 pins and its assignments vary according to the use. Among all the available pins, 6 are unidirectional in which data or communication flows towards the controller and the remaining 14 pins are bidirectional to the device that are connected to it. Top view pin assignment of R8C/1B series is shown in below figure 2.3.
The microcontroller has to be used to collect the data for the analog to digital conversion. Several different types of microcontrollers are available in the market from different manufacturers with different capabilities. Such as in built random access memory (RAM), read only memory (ROM), input/output (I/O) ports, Timers, ADC, digital to analog converter (DAC) etc. block diagram of MCU is shown below in figure 2.4.
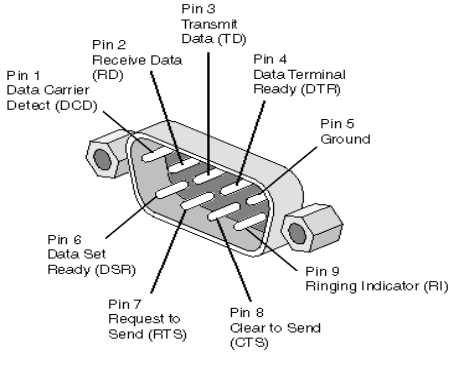
Figure 2.7.RS232 Serial Port functional diagram
Normally, modern computers are not equipped with a parallel port. Therefore the present system is designed to use the serial port. Although the serial port is also about to be obsolete, devices connected to the serial port can still be used since many relatively cheap USB ‐ RS232 interfaces exists in the market. Functional diagram of RS232 serial port is shown in above figure 2.7.and the advantages of using serial data transfer rather than parallel data transfer.
METHODOLOGY
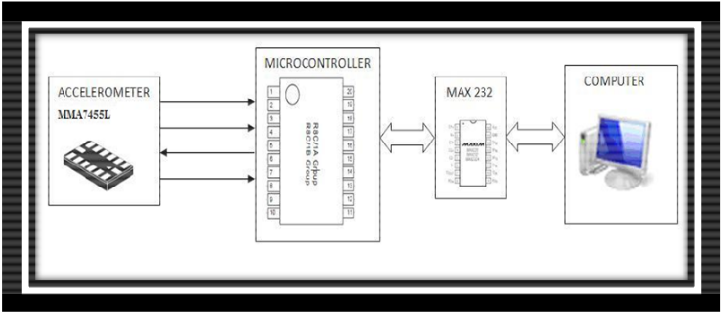
Figure 3.1 Block Diagram of the Tremor analysis system
The block diagram of the system is shown in figure 3.1 below. The system consists of the accelerometer sensor, the Micro controller, a micro controller program to acquire data and transfer it, a level converter to connect the micro controller to the PC via RS232 or DB9 connection. Post processing to display data and extract parameters of interest is carried out by Mat lab installed on the PC.
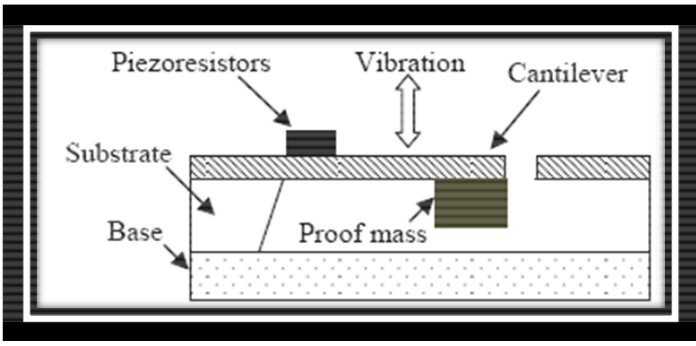
Figure3.3. Diagram of MEMS Piezo‐resistive accelerometer
The Piezo‐resistive MEMS accelerometer is shown in Figure 3.3.when the device is exerted by acceleration, the gap between the mass and the bulk of the device changes. The voltage produced by the Piezo‐resistive patch and the bulk device due to external stress is proportional to the acceleration of the vibrating object.
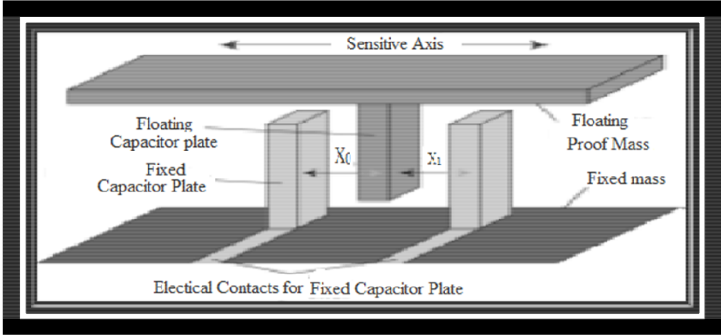
Figure 3.5 Diagram of differential capacitive layout
The capacitance is either made as single‐sided or differential pair. A differential capacitive pair is shown in Figure 3.5 with conductive proof mass, and a connection between the spring‐proof mass serves as the electrical connection to the floating capacitor plate. Capacitive sensors are most commonly used in accelerometers fabrication. Single ‐ sided capacitive accelerometers can be designed with the perpendicular axis of the silicon die plane and the capacitor plates in the plane of the die, sensitivity of the capacitor increase by extending its area.
DESIGN
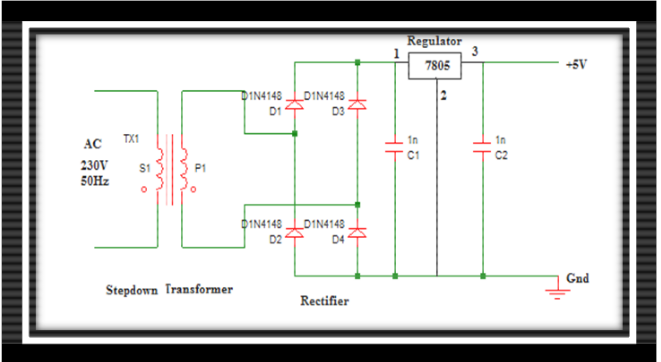
Figure: 4.1. Block Diagram of Power supply
In the present project design, RENASAS R8C Microcontroller and the associated digital circuits require +5V regulated power supply for their operation. Thus, the power supply circuit has to provide 5V regulated power to the DAC and micro controller. The DC power required is derived from a 230V AC supply mains. Power supply block diagram is shown in below figure 4.1.
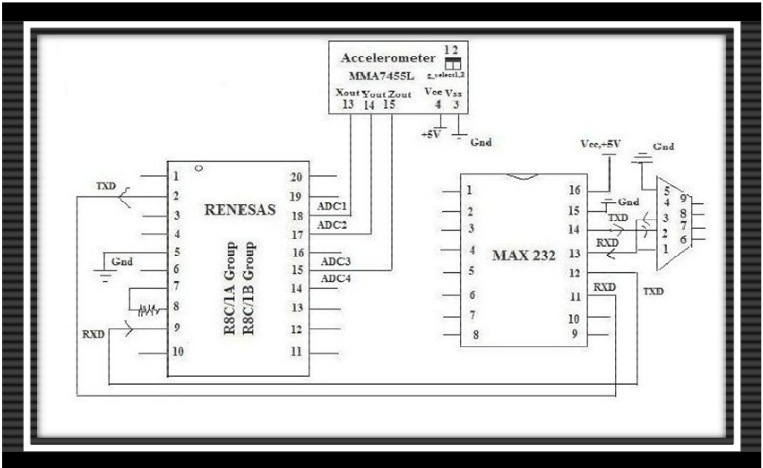
Figure 4.6 Pin configuration of Tremor Hardware kit
The accelerometer printed circuit board (PCB) cannot be directly mounted on the limb, so it is mounted in a small plastic container and suitable fastness fixed to the container. A five core cable is drawn from the accelerometer container to the micro controller unit. To avoid external interference a shielded cable has been used. The analogue outputs from the accelerometer are directly interfaced to the micro controller analogue input pins, through a voltage limiter circuit for protection. In order to understand clearly the concept behind the pin configuration, figure 4.6 above gives the block diagram of the tremor hardware kit.
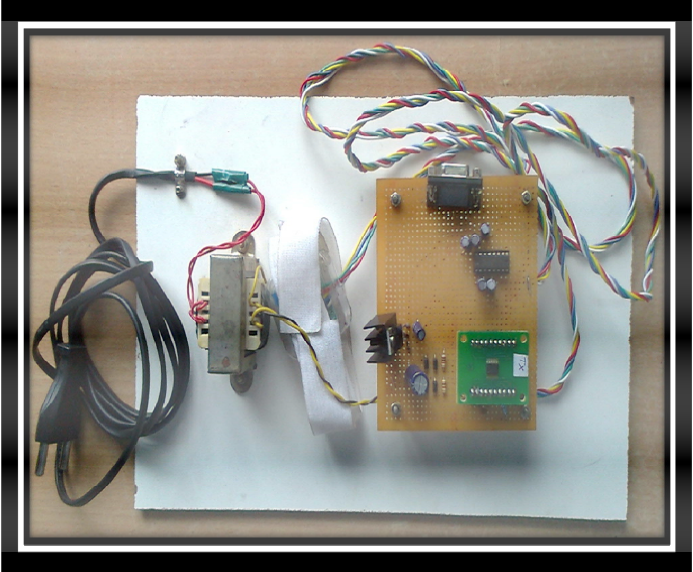
Figure 4.7 Snapshot of Tremor hardware kit
The micro controller sends the binary values through the serial port to the MAX 232 IC after sampling the analogue values. These values are fed to the PC using the null modem concept. The required power for this section is derived from a power supply, which has been designed. The power supply provides a 5V regulated output which is also be used by Accelerometer sensor. The final picture of the tremor kit designed is shown in below figure 4.7.
RESULTS
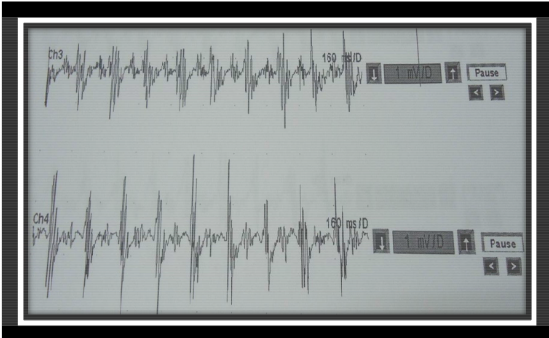
Figure 5.2.EMG waveform for Parkinson’s tremor
Earlier Physicians were using EMG machine to observe the muscle contraction using four electrodes which are attached two to each hand i.e. muscle flexors and extensors. A waveform is generated where the frequency of the hand movement is calculated indirectly.
Calculation of Frequency for the figure 5.2 above
Total no of bursts = 9
Time period = 1600ms
Frequency = 5.6/second (9/1600ms)
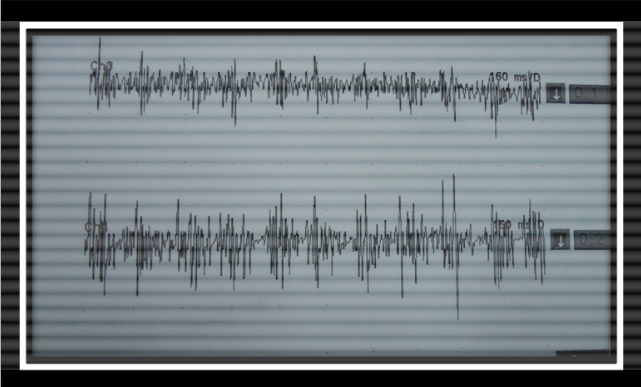
Figure 5.3EMG waveform for Essential Tremor
Frequency for the above waveform is 7Hz (11 bursts in 1600ms or 1.6 s). This method is the approximate estimate by calculating the number of burst per cycle from the graph. The machine is not portable and at the same time very expensive.
CONCLUSIONS
Design of an accelerometer system using a microcontroller and a PC has been fulfilled to measure the frequency and amplitude of the human hand tremor, it has also been tested under the guidance of clinical physician.
The method has been verified by comparing it to the state of the art methods (EMG). The agreement is satisfactory which is shown in the result section above.
The Signal produces by the accelerometer is a bit weak, and it is hard to extract the frequency components though the signal conditions are perfect. This problem occurred during the measurement on subjects with low shaking in their hands. Adding an amplifier to the hardware circuitry may solve the problem permanently and this enhances the performance of the overall system. The addition of amplifier also reduces the discrepancy between existing EMG based technique and the proposed technique.
The main advantage with the proposed technique lies in the additional information it provides compared to the existing EMG based method. The EMG technique only provides the tremor frequency, but not its amplitude. In the present design, the amplitude and also the frequency are provided. This information can be used in establishing the treatment procedures.
At the moment the device is ready to take into the camps by the physicians for measurement of tremor frequency and amplitude.
The equipment developed is working satisfactorily; but the system can be further Improved. In the existing model, the PC is used to analyze the signal and provide results.
Instead the micro controller can be programmed to analyze the signal and provide the extracted parameters on a Liquid Crystal Display, which then would be needed to interface to the micro controller. This would transform the device into a portable and flexible unit, which would provide a cost effective and efficient solution to the existing problems of accuracy, cost, time and portability.
Source: Mid Sweden University
Author: Santosh Bejugam
>> Matlab Projects for Biomedical Engineering Students
>> Image Processing Project Topics with Full Reports and Free Source Code
>> Huge List of Matlab Projects with Free Source Code
>> 50+ Matlab projects for Digital Image Processing for Final Year Students
>> 200+ Matlab Projects based on Control System for Final Year Students
>> 80+ Matlab Projects based on Power Electronics for Engineering Students
