ABSTRACT
With the quest to undertake ambitious tasks in space, proximity operations involving multiple spacecraft are expected to increase. A vital part of any proximity operation is the relative range and pose measurement between spacecraft and target. In the past sensors have been expensive and only capable of being used with cooperative targets.
Recent years have seen the start of a technology race to bring low cost depth sensors(LIDARS) to consumer devices. The aim of this project is to demonstrate that one of these low cost C.O.T.S. depth sensors could be used in close proximity operations to facilitate rendezvous and docking operations for CubeSat sized satellites.
This report details the selection of a low cost LIDAR, the Softkinetic DS325. A Linux ARM driver is developed to interface this with a Raspberry Pi to process depth data and obtain range and pose estimation. Test hardware is developed to facilitate in the loop testing using simulator satellites on air bearings simulating a 2D frictionless environment.
The report demonstrates that it would be possible to use a low cost LIDAR on a CubeSat sized mission, and highlights the difficulties that this technology brings especially in interfacing with a relatively low capability processing board. In addition, the driver modified as part of this project becomes the first correctly working open source driver for the Softkinetic range of depth sensors.
LITERATURE REVIEW
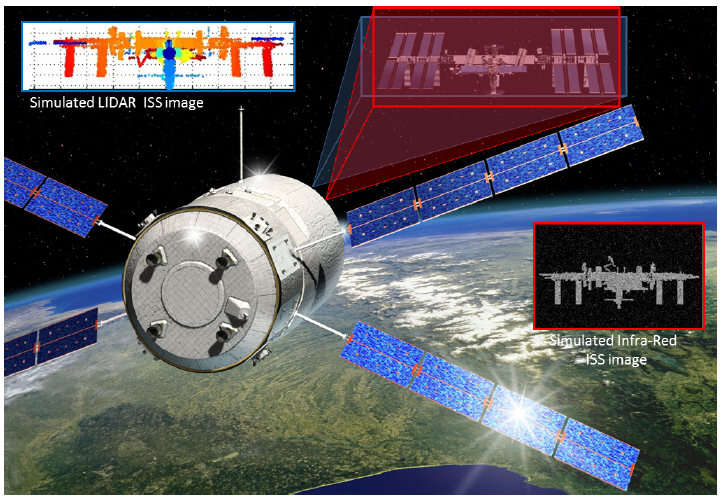
Figure 2.1: Graphics Depicting the LIRIS Experiment.
A similar test being conducted by ESA (European Space Agency) is attempting to gather data on LIDAR imaging. ATV-5 Georges Lematre is in orbit at the time of writing and carries the LIRIS (Laser InfraRed Imaging Sensors) depicted in Figure 2.1. While only a passenger payload at the current time, the aim is to gather test data to demonstrate that a LIDAR can be used as a rendezvous sensor for a non-cooperative target. This is equivalent to the aim for this project, but on a larger scale. Whilst little information other than press releases are currently available, the mission illustrates the importance of this subject is recognised by different space agencies, and some of the uses for the capability.
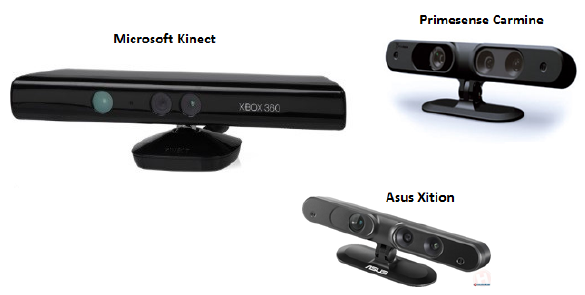
Figure 2.2: Primesense Family.
Following on from the release of the Kinect, Primesense started to release it’s own family of products base on the same technology starting with the Carmine. In addition, they started to licence their technology to other companies such as ASUS with the Asus Xition. The family is depicted in Figure 2.2. As they have nearly identical chipsets, all are very similar in capability.
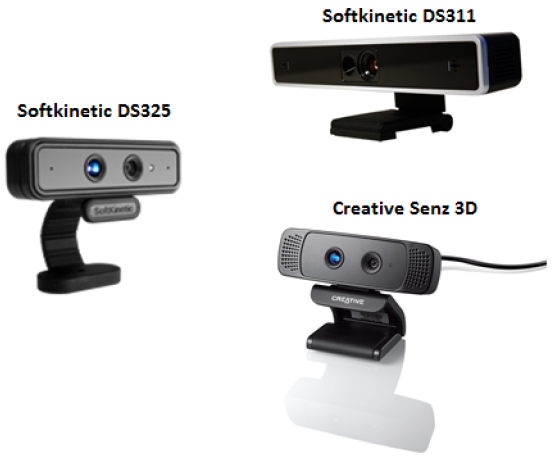
Figure 2.3: Softkinetic Family.
It is able to detect objects as close as 15cm. Initially the new Softkinetic DM536 was considered as it was the smallest. However the module is not currently on sale. After contacting the company it was found that DM536 was identical to the DS325 (except for the casing) and so the DS325 could be disassembled to achieve the same objective with a waiver obtained from Softkinetic. In terms of interface drivers, Softkinetic have released drivers for both Windows and Linux. Currently no Linux ARM version has been released meaning that a driver for the Raspberry Pi would have to be developed. The softkientic family is depicted in Figure 2.3.
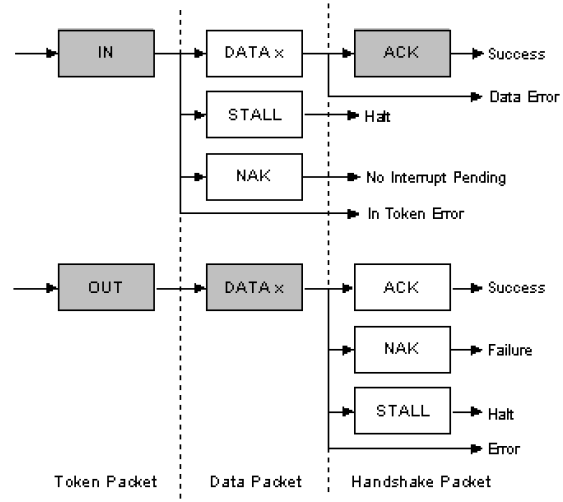
Figure 2.6: USB Data Flow Schematic.
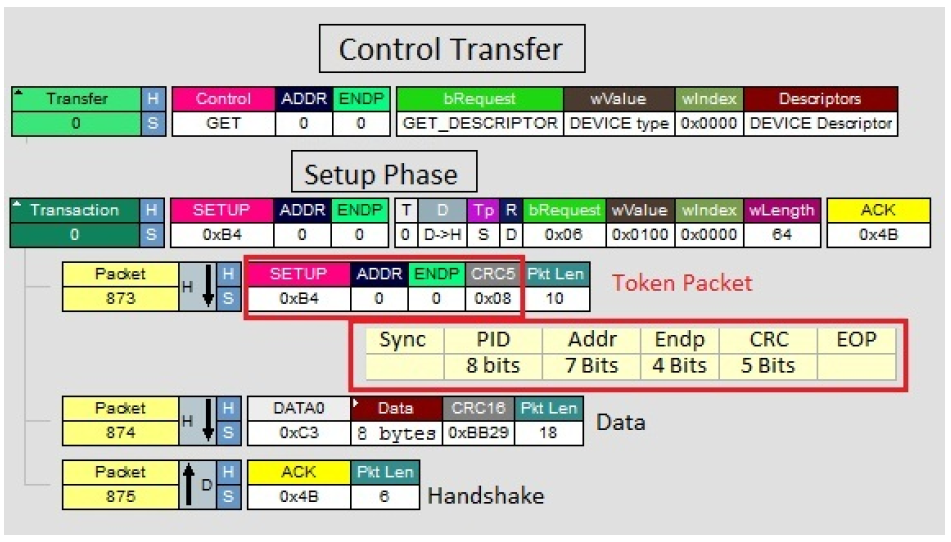
Figure 2.7: Isochronous and Control Transfer Packet Black Diagram.
Bulk Transfers Used to transfer large amounts of data which requires guaranteed delivery. eg. Printer data. At a lower level, different parts of the transfers are broken down into separate packets depending on the transfer type. The data flow and packet specification of a Control Transfer is shown in 2.6 and 2.7 respectively.
HARDWARE DEVELOPMENT AND SET-UP
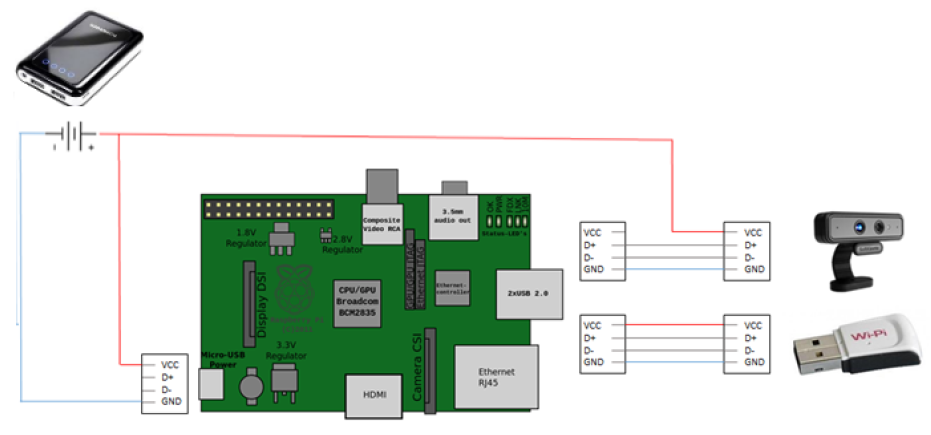
Figure 3.2: Schematic of system.
Whilst the Raspberry Pi can provide current up to 500mA, the documentation states that the USB power was designed for 100mA usage and “…while it is possible to plug a 500mA device into a Pi and have it work with a sufficiently powerful supply, reliable operation is not guaranteed.” This was proved to be the case.
To solve this issue, power was directly fed from the battery to the LIDAR via the +Vcc cable in the USB (Universal Serial Bus). The GND (ground) connection was left connected to Raspberry Pi to provide a common ground for the signal lines. The full power supply of the system is shown in Figure 3.2.
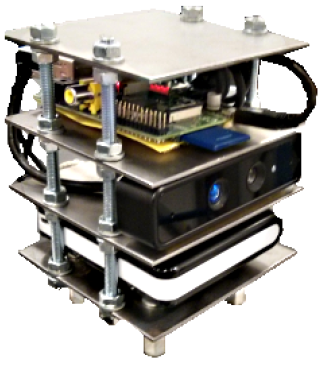
Figure 3.3: Pic of Final Structure.
This overall design as shown in Figure 3.3 proved a very good design for testing both this payload and other test payloads. It provides a rigid test platform, whilst giving the ability to be connected / disconnected from the simulators with four extended nuts.
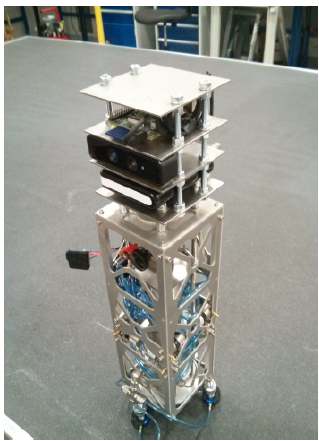
Figure 3.4: The Full Air Bearing System with LIDAR attached.
A separate Lithium Ion battery was used to power the on-board Arduino for control of the thruster solenoids. The battery was non rechargeable, and so for final testing, the battery was replaced with a USB cable and powered using the same battery powering the LIDAR.
SYSTEMS INTEGRATION
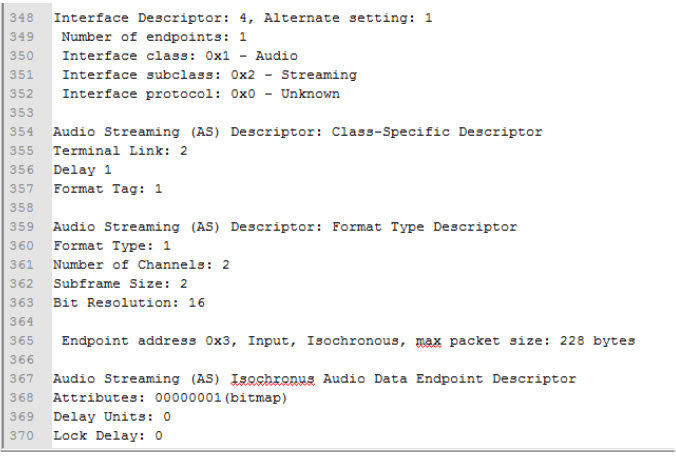
Figure 4.2: Example USB Enumeration Data.
USBlyzer and Device Monitoring Studio were then used to interrogate the USB interface and determine how the device was enumerated. Painstakingly several hundred lines of data were analysed to pin down critical data such as the endpoint address of the depth sensor. Examples of this data are shown in Figure 4.2.
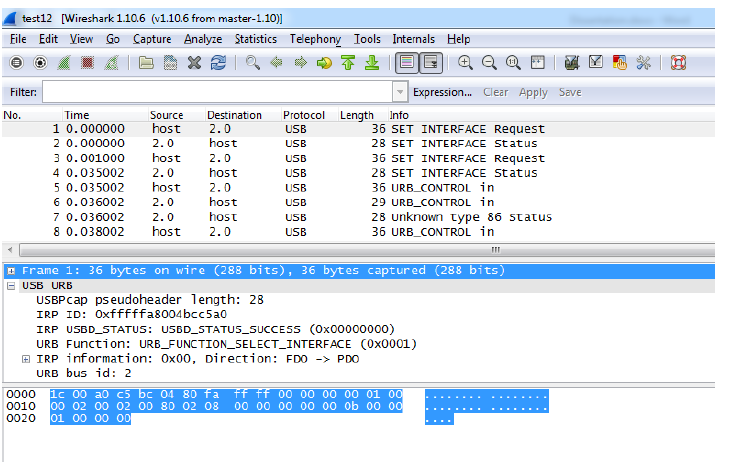
Figure 4.4: Screenshot of Packet Sniffing using Wireshark.
As more efficiency was gained with the understanding of the packet data, Wireshark + Winpcap were used increasingly as this allowed access to all the raw data. Winpcap was used to ‘sniff’ the data as this feature is not availible in Wireshark. Wireshark was then able to display the data as in Figure 4.4.
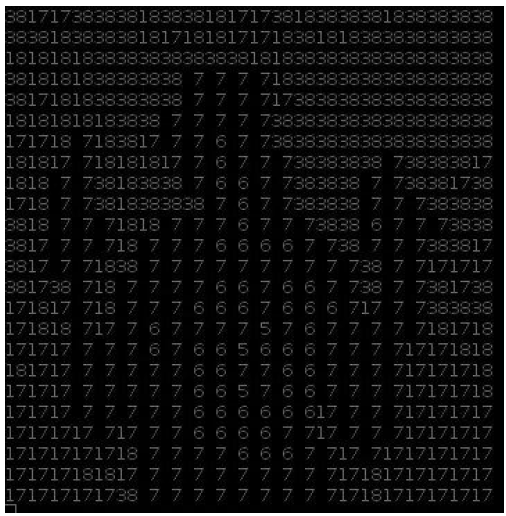
Figure 4.7: Image Showing Basic Test Output of Depth Stream.
Basic test output was displayed as an ascii depth map where 1 represented 100mm, 2 = 200mm. This was activated using the command line argument display when running the program. Due to the limited number of characters only every 16 pixels were sampled. This was adequate to show that the depth data was streaming, as shown in Figure 4.7.
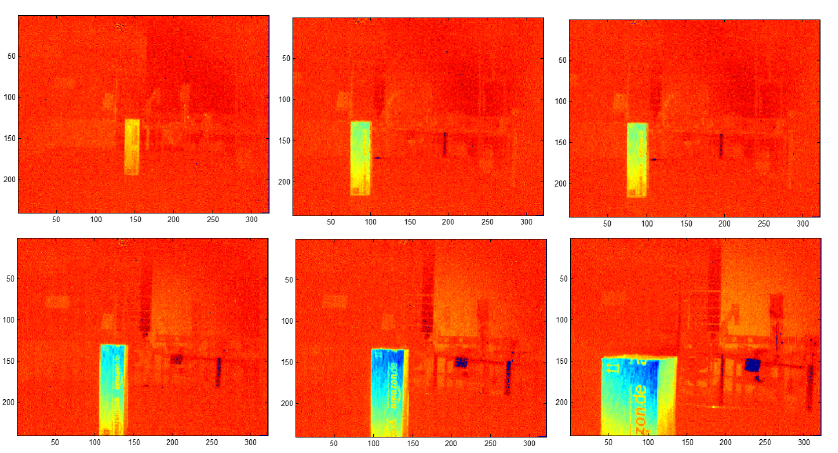
Figure 4.15: Consecutive Images of Matlab Streaming Output On Air Bearing Table.
On the client PC side, in built commands were used in Matlab to set up TCP and UDP sockets to read the data. This proved straightforward to set up and data was able to be streamed successfully using both methods. Example output is showing in figure 4.15.
TESTING AND VALIDATION
Several tests were done to try and find the best filter which was able to identify a spacecraft from background noise. The first results are from the erosion filter.
Next the segmentation algorithm was analysed. It was first run for different threshold values. The threshold value controls how close the depth value two points have to be, to be considered in the same group. The colour in the images in 5.3 describe the group each pixel belongs in.
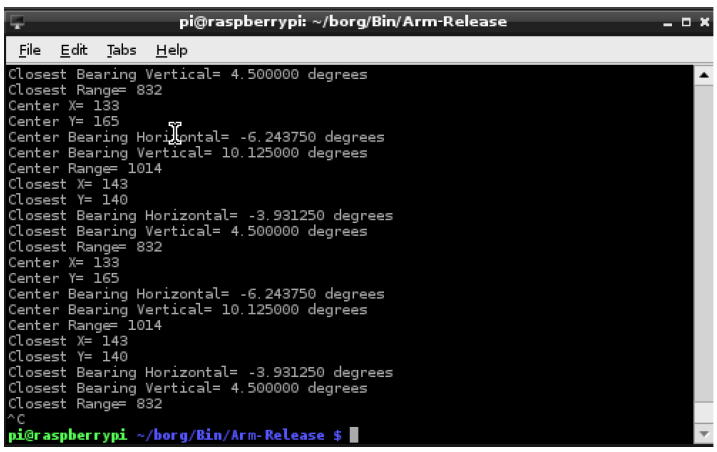
Figure 5.6: Screenshot Showing Output of Range and Bearing Data to Target.
The basic range detection algorithm was not able to be tested fully with live data. No accuracy tests could be done with this as no measurement of the physical layout could be taken. However this was able to be tested with previously collected test data. The console output of one of the tests is shown in Figure 5.6.
CONCLUSION
The aim of the project as stated at the start of the project:
”To demonstrate that a Low Cost C.O.T.S. LIDAR can be used as a rendezvous depth sensor for Satellite Proximity operations.”
This was not demonstrated outright due to the failure of the LIDAR during testing. However, a full system has been demonstrated that includes returning data from the sensor, processing it on the presumptive processing board, and returning range and bearing data.
- To research and select suitable depth camera. This will involve a literature review of different sensors and a SWOT analysis to assess the merits of candidates. This was successfully completed and the Softkinetic DS325 was chosen. Whilst having limitations, it was successfully able to fulfil the majority of aims and objectives for this project. The SWOT analysis proved to be worthwhile as it highlighted the uncertainly surrounding the Primesense family which would have problem to be a problem for the future applicability of the project.
- To develop suitable hardware interfaces to support development data acquisition and testing. This involves designing a suitable hardware structure to contain the LIDAR and control board, provision of suitable power supply, as well designing a physical interface to test air-bearing satellites. This objective was comprehensively met. The air-bearing satellite test apparatus was brought into full operation. A comprehensive test program was developed which was able to perform several different functions including streaming live data to a client pc in real time. A good hardware design was constructed, one which will be a good template for future demonstrations.
Source: University of Surrey
Authors: Richard DUKE
>> Matlab Projects Fingerprint Recognition and Face detection for Engineering Students
>> More Matlab Projects using Arduino for Final Year Students
>> 200+ Matlab Projects based on Control System for Final Year Students
>> 80+ Matlab Projects based on Power Electronics for Engineering Students

