ABSTRACT
We designed and developed an instrument that produces sound when the user initiates vibrations on a steel rod. These mechanical vibrations are converted into a voltage signal by a pickup like those used for electric guitars. This voltage signal is then amplified. The vibrations are reinforced and sustained by a driver coil, an electromagnet that produces a time-varying magnetic field which will alternately attract and repel the steel rod. When the user slides the rod, the pitch will change.
The basic design has been shown to be functional, but it operates inconsistently. In this paper we will explore reasons for its inconsistency and recommend solutions as well as additional features, such as a means of controlling volume and applying effects to the instrument’s sound.
DESIGN
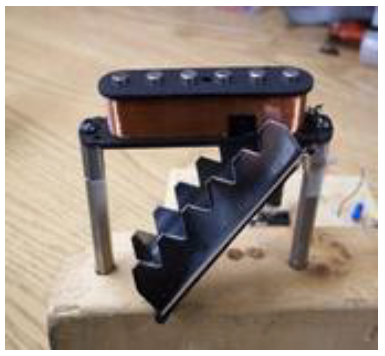
Fig. 2.2. Photograph of the pickup.
We used a standard magnetic guitar pick up in our design. A photograph of the pickup coil is shown in figure 2.2.
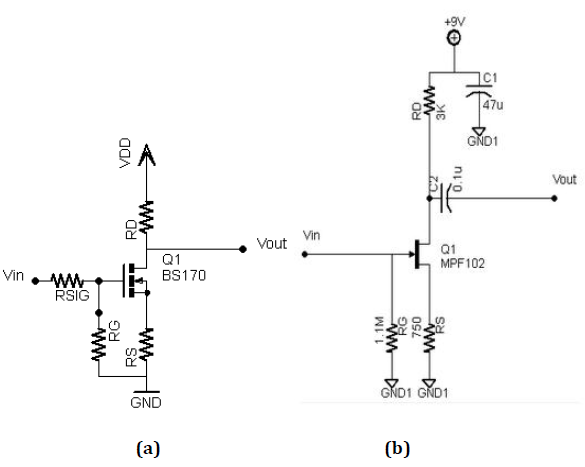
Fig. 2.3. (a)General Circuit of the Common Source Amp with Source Degeneration Resistor (b) Schematic of the pre-amplifier.
The pre-amplifier is designed using a JFET in a common source amplifier configuration with source degeneration as seen in figure 2.3(a). The transconductance of MPF102 as seen in figure 2.3(b) is given as a range of 2000uS and 7500. The gm of the pre-amplifier is arbitrarily to chosen to be 5000uS in our design of the amplifier. Referring the coupling capacitor before the output pin of the pre-amplifier blocks DC from feeding into the power amplifier.
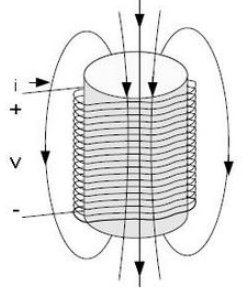
Fig. 2.5. Illustration of the driver coil.
The driver coil’s function is to produce a time-varying magnetic field that will cause the rod to vibrate. Its inputs are a time-varying current and voltage. While just wrapping wire into a coil and passing a current through it will produce a magnetic field, the magnetic field will be stronger if the wire is wrapped around a ferromagnetic core, such as iron. In our design we used a cylinder of iron with a diameter 0.5 inches as the core. Figure 2.5 is an illustration of the driver coil, showing the magnetic field lines it produces.
DESIGN VERIFICATION
Fig. 3.1. Testing the rod and pickup. In (a), the calculated theoretical fundamental frequency at this length of 24.3 cm is 59.85 Hz, and the pickup measured 59.00 Hz, which corresponds to the peak of the FFT (purple).In (b), the theoretical frequency at this length of 19 cm is 97.89 Hz, and the pickup measured 98.00 Hz.
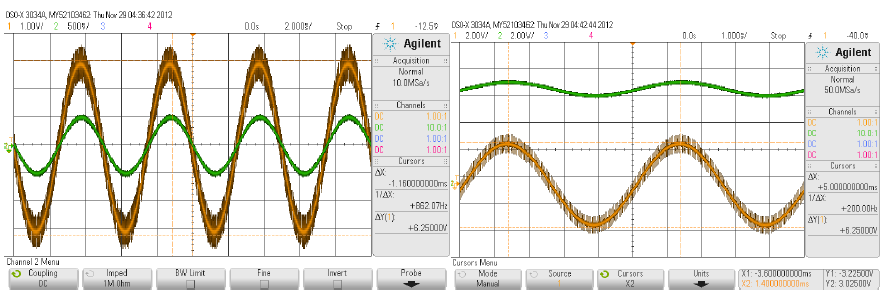
Fig. 3.3. Testing the power amplifier (a) with a gain set to 6.25 and offset 0 V, and (b) with a gain set to 6.25 and a voltage offset of 2 V.
The power amplifier needs to be able to produce an output signal that is the input voltage signal multiplied by the gain. Different values of the gain were tested by changing resistor Rf in figure 2.4 from section 2.8. Figure 3.3 shows that for a gain of 6.25 V/V, a 1 V peak-to-peak sine wave is amplified to 6.25 V peak-to-peak, with no voltage clipping when the offset is increased, and little noise. A frequency sweep was done on the function generator, and the gain was consistently 6.25 V/V for all audio frequencies, with no distortion until the offset voltage was increased to 3 V.
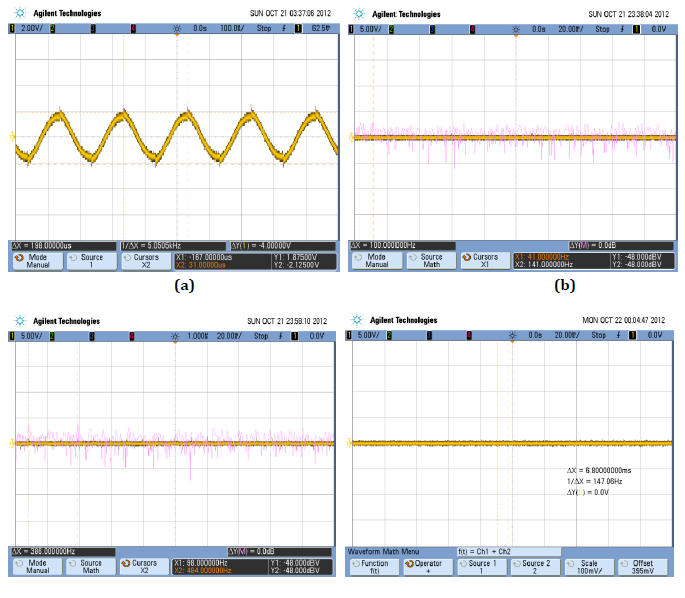
Fig. 3.4. Testing the driver coil. The input frequencies are 5.02 kHz, 40.0 Hz, 98.0 Hz, and 145 Hz for (a), (b), (c), and (d), respectively. The frequencies measured by the oscilloscope are 5.0505 kHz, 41.0 Hz, 98.0 Hz, and 147.06 Hz for (a), (b), (c), and (d), respectively.
The driver coil’s main function to to vibrate the rod at the same frequency as the input frequency. The driver coil, driven by a function generator, was held up to the end of the rod. A pickup was also placed underneath the rod, and the oscilloscope displayed the signal from the pickup. The frequency of this signal was measured and compared to the input from the function generator. This test was repeated for several different frequencies, and the driver coil passed every test. An oscilloscope waveform from these tests is shown in figure 3.4.
CONCLUSION
We started this project with little knowledge of amplifiers or the mechanical components of the instrument. It was a very abstract concept which became clearer as the semester progressed. We feel very accomplished in our progress and the design of the instrument even though the instrument did not work consistently during the demo. One of the greatest accomplishments we feel is that the whole instrument worked the day before the demo.
Due to problems arising from the inconsistencies of the power amplifier IC chip, we are uncertain how long the rod can vibrate before the power amplifier chip overheats. additional impulse to the rod. We are however certain that the rod can vibrate continuously for 15 minutes before the power amplifier chip gets overheated. This could be because of the high gain of the power amplifier.
The maximum output signal of the pickup is about 1 V. If the gain of the pre-amplifier is 2.5 V/V and the gain of the power amplifier is 14 V/V, that is an output voltage of 35 V peak-to-peak. Considering that the resistance of the load is about 6 Ω, this gives an output current of 5.83 A, and a power dissipation of about 200 W, which exceeds the amount of power that the chip can provide. The next step is to reduce the gain of the power amplifier so that it doesn’t produce quite so much power.
Source: University of Illinois
Authors: Venkata Geetha Bijjam | Rachel Pashea
