ABSTRACT
During the last few decades technology used in crop production has developed noticeably. The work of farmers has decreased and continues decreasing by means of technology and automation. The aim of this research project was to find out requirements for methods and automated machines needed in automated crop production.
Agricultural machines capable of utilizing variable rate application (VRA) technology enable considering spatial variability in agricultural fields during different field operations. Agricultural field robots are the next step in technology, capable of utilizing sensor and actuating technologies, without human driven tractors. However, agricultural field robots are still under research, and commercial products do not exist.
The next generation of crop farming, in the vision of authors, is based on automatic crop farming, which incorporates stationary and moving sensors systems, robots, model based decision making, automated operation planning which are adapting to spatial variability according to the measurements as well as to weather conditions.
This article presents a top-down approach of automated crop farming using simulation, trying to cover the most important pieces on a fully automatic farm and the environment is modelled. The developed simulation environment is presented as well as preliminary simulation results. The environment simulator is based on a collection of models, including models for crop and weed growth, soil water flow and generators for spatial variation and statistically varying weather.
INTRODUCTION
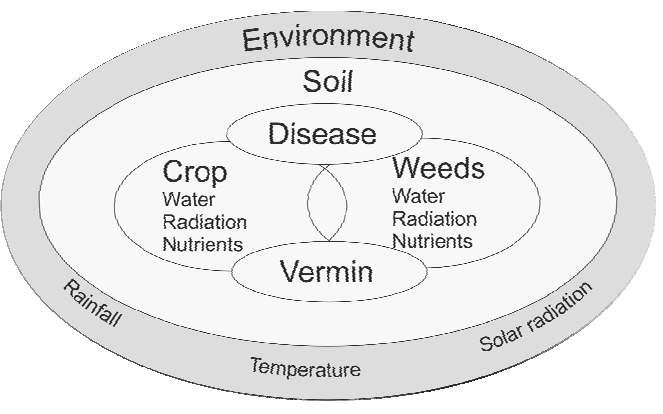
Figure 1. Schematics of the components related to the crop growth model.
To attain this aim the existing models were used when possible. Missing models were developed but the emphasis was on structure. The models are aimed to be as simple and transparent as possible so that they can be used as a tool for decision making e.g. in choosing machines and timing cultivation operations. Schematics of the components related to the crop growth model are presented in Fig. 1.
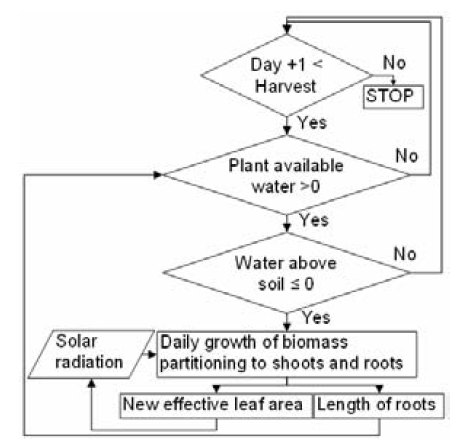
Figure 2. A flowchart of the calculations in the plant growth model.
The overview of one version of the plant growth models is presented in Fig. 2. The model contains fixed parameters and the magnitude of each may be altered by a multiplication factor in order to find out its influence on the plant growth. The model and its parameters are: mass of seed, biomass partitioning between shoot and root, sowing density and specific leaf area. In its most primitive form the model is fully analytical (Hautala and Hakojärvi 2010).
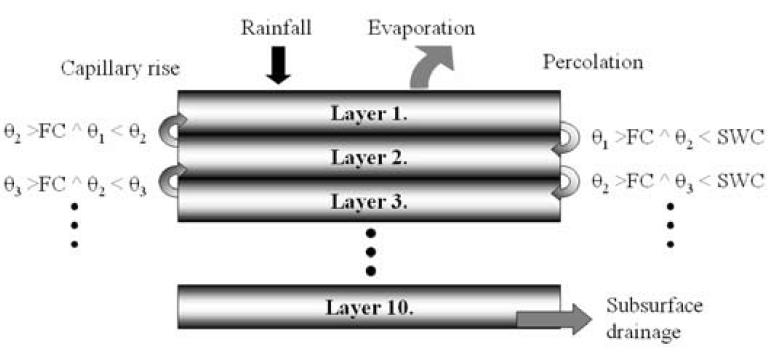
Figure 3. Effect of evaporation, transpiration, rain and drainage to water content θi of each layer in soil and water percolation downwards in soil.
The model for the soil water movements used here includes 10 layers (Fig. 3). At first the water flow from one layer to another was calculated according to Darcy’s law. The benefits of this approach are the changes of soil affecting the water flow in soil as a function of soil moisture content, which makes the soil moisture changes realistic. However, in larger areas the calculation of this procedure takes considerable amount of time.

Figure 5. Work flow of AutoCrop simulator.
In the basic computing phase (in Fig. 5) the scenario is converted to the simulator applicable format. This includes rasterising 3D surfaces created in the scenario using the grid size parameter. In the basic computing phase, also cloudless solar radiation is generated for the whole season beforehand (using ArcGIS Solar Analyst). In addition, other static properties of the fields are computed at this time, like an inclination rate and direction in each cell, and cell neighborhood arrays.
RESULTS
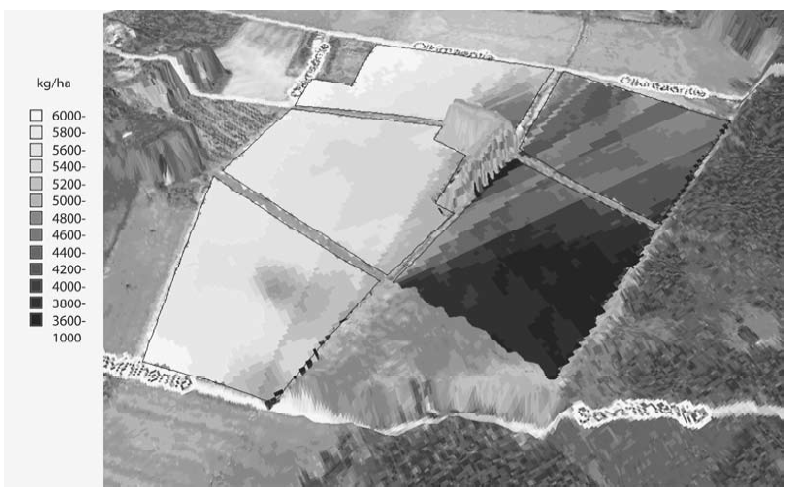
Figure 6. Simulated site-specific grain yield in five different fields.
In Fig. 6, the above ground results of the crop growth model are presented. Most of the variation in the grain yield comes from solar radiation variation, which is caused by the shading of forests during the day. The shadow areas produce less yield and this can be seen as dark areas in Fig. 6. The forests are modelled as non-transparent objects and the effect of decrease on solar radiation was computed using ArcGIS Solar Analyst. The solar radiation depends on the date of year as well as cell location in the field.
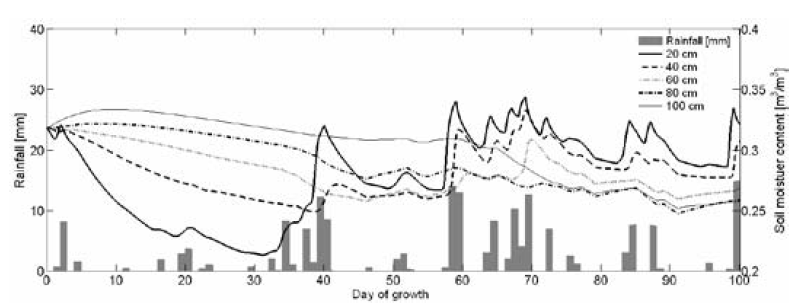
Figure 7. Simulated rainfall and soil moisture contents from several depths of soil in one cell of field.
In Fig. 7 Monte Carlo rainfall for one growth season at one site is presented as well as consequent variations in soil moisture at five different depths. The crop root growth and water use can be seen from decreasing soil water contents as a function of time and depth of soil. In Fig. 7 the soil water model based on Darcy’s equation was used.
DISCUSSION AND CONCLUSIONS
In the developed AutoCrop simulator, software integration was used to combine the good properties of specific simulation and software tools. Two different approaches were tried to do the simulation phase, the first way was to compile Simulink model to C++ and further .NET component and run the simulation using ArcGIS; and the other way to use Matlab as a simulation engine. It was found that the first one is better even if it takes more time to develop.
The computing efficiency comparison showed that the first approach took less than 2% computing time compared with Matlab approach. For the presented scenario (Fig. 6) with 9000 cells of 5 x 5 meters, using simulation time step of one hour and data store to the database every other simulated day. The simulated growth period corresponded to the actual time period from the beginning of April to the end of September and took about 10 hours to compute with P4@3.2GHz processor. This computing depends on grid and time step parameters, but also on models used in the simulation, as mentioned above.
The present models applied in the simulator can not be used to simulate winter cereal crops, because overwintering is not included in the model. However, if initial values of the crop model were entered in the model, the simulator could simulate the growth of winter crop. Cultivated as spring crops, the presented crop growth model would apply to all C3 crops.
Source: University of Helsinki
Authors: M. Hakojärvi | M. Hautala | J. Ahokas | T. Oksanen | T. Maksimow | A. Aspiala | A. Visala