ABSTRACT
We espouse a vision of small data-based immersive retail analytics, where a combination of sensor data, from personal wearable-devices and store-deployed sensors & IoT devices, is used to create real-time, individualized services for in-store shoppers. Key challenges include (a) appropriate joint mining of sensor & wearable data to capture a shopper’s product- level interactions, and (b) judicious triggering of power-hungry wearable sensors (e.g., camera) to capture only relevant portions of a shopper’s in-store activities.
To explore the feasibility of our vision, we conducted experiments with 5 smartwatch-wearing users who interacted with objects placed on cupboard racks in our lab (to crudely mimic corresponding grocery store interactions). Initial results show significant promise: 94% accuracy in identifying an item picking gesture, 85% accuracy in identifying the shelf location from where the item was picked and 61% accuracy in identifying the exact item picked (via analysis of the smartwatch camera data).
RELATED WORK
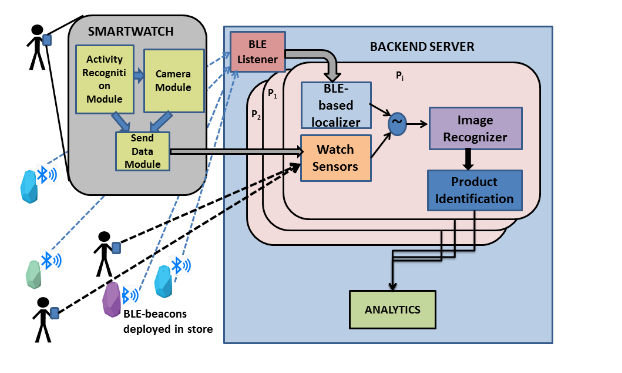
In the back-end, there is a module for listening to accelerometer data from BLE beacon. There is a separate module for listening to data from the smartwatch. Once data from a smartwatch reaches the server, a new sub-process is started for the person. This sub-process handles further incoming data from the smartwatch. As more data comes in, the RSSI of BLE beacon heard on the smartwatch are used to filter out beacons which are not in proximity of the user.
Accelerometer data from BLE beacons which are in proximity is correlated with the accelerometer data from the smartwatch to determine which door has the user interacted with. Identification of the door that the user has interacted with helps in narrowing down the identification of possible items the user has interacted with (as a rack will have only a subset of objects present in the store). Next, based on image recognition, the server can identify the exact object the shopper interacted with. Figure 1 illustrates our architectural framework with the devices, server components and flow of the analytics pipeline.
ARCHITECTURE AND STUDY DETAILS
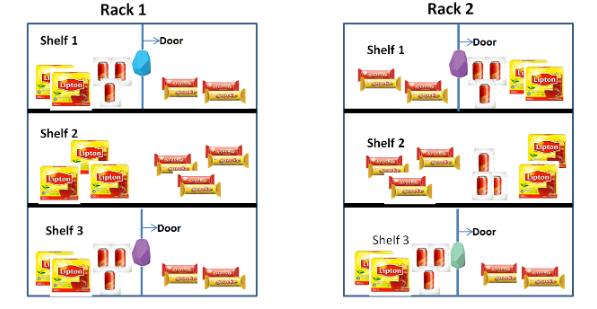
We next describe the location of our study. For our study, we emulated an aisle in a grocery store in the pantry area of our lab as shown in Figure 2. The pantry area in the lab has multiple racks and each of these racks has shelves at multiple levels. We used 3 shelves in 2 racks, which were 1.7,0.85 and 0.5 meters from the ground level. The top and bottom shelves had hinged doors. In terms of distance between the two racks, the two racks are 1.1 meters away from each other.
On each of the 3 shelves in both the racks, 3 category of items were placed – (i) boxes of Lipton tea (Item-I1) (ii) cold drink cans (Item- I2) and (iii) biscuit packets (Item-I3). We attached one BLE beacon each on the doors of the shelf. For our experiments, we kept the transmitting power of the beacons at -20dBm so that at this level the beacon couldn’t be heard beyond 3 meters.
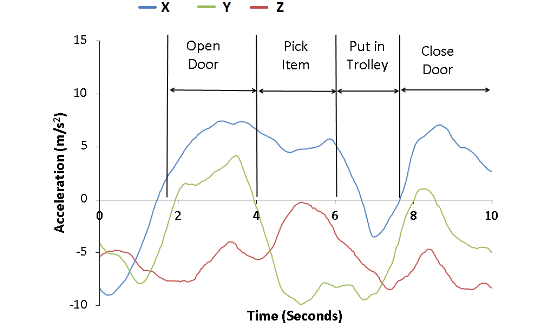
Fig.3: Accelerometer reading for a sequence of hand activities
Figure 3 shows how the accelerometer reading varies for the different activities in the sequence. We next extracted the features mentioned in from the data. We used the decision tree implementation in Weka for our classification. A 10-fold cross validation was performed to see if we could distinguish picking item from other gestures. We found that we could achieve an accuracy of 88% when we ran a classifier for multi-class identification (picking, putting back, open door, close door, put aside). Since we wanted to identify picking gesture (so that we could capture image during the gesture), we labelled all non-picking classes as others.
SHOPPING ACTIVITY DETECTION
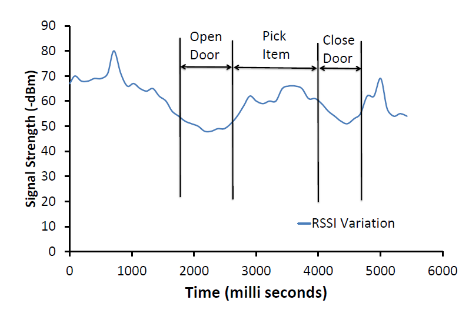
Fig.4: Variation of BLE signal during shopping activity
As we showed in the previous sub section that the RSSI drops when the hand came closer to the beacon (See Figure 4). However just relying on RSSI to determine the rack of interest can lead to high false positives. For example, when a shopper walks past a rack, the received signal strength from beacon will peak. RSSI can be a good localizing factor, but we need to correlate the data from the inertial sensors on the watch with that on the beacon. In our experiment, when the user opened or closed the door of the top shelf, we observed a sudden spike in the accelerometer of the beacon attached to that door, whereas the reading from the accelerometer of the beacon attached to the door of the bottom shelf showed no variation.
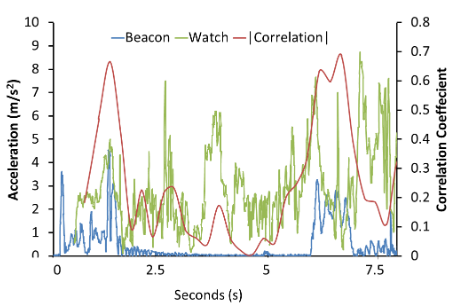
Fig.5: Correlation between magnitude of accelerometer data of beacon and watch
This suggested that using sensor-based features from both the BLE beacon and smartwatch would improve the accuracy of detecting which door the shopper has interacted with. On correlating the accelerometer signals from the smartwatch and the beacon, we found that there is a high correlation between the two signals during the ‘Door Open’ and ‘Door Close’ gestures, as shown in Figure 5.
We plotted the magnitude of the watch accelerometer and beacon accelerometer for the different gestures in the activity sequence and found that during the door open and door close gestures, the correlation coefficient is always above a threshold, which we empirically determined as 0.5. Based on this,we can claim that independent of the user’s height, based on correlating data from a user’s device with an infrastructure sensor, door activity can be easily determined.
CAPTURING IMAGE OF ITEM
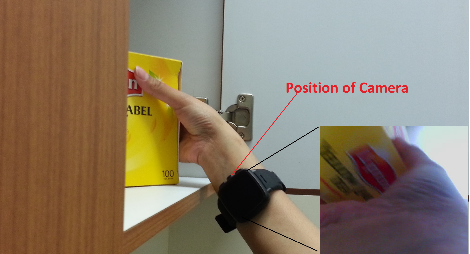
Fig.6: Camera view and an image captured while an item is being picked
An alternate approach to identifying objects that a person interacted with is by capturing the image of the object using the cameras in the wearable devices. This section discusses our study of this approach using our experimental setup that was described earlier. While performing our experiments of picking items, we found that for a short period of time, the camera on the watch usually points towards the item that is being picked.
We wanted to see if it is possible to capture a legible image of the item being picked from the camera. In the smartwatch that we used in our study, the camera is located on the side of the watch as shown in Figure 6. We found that if the watch was worn normally, we could not capture images of objects.
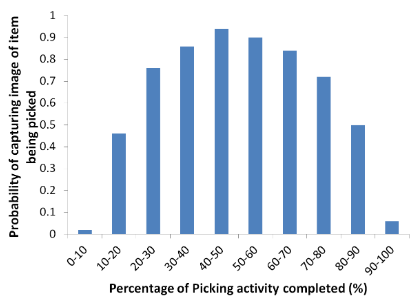
Fig.7: Probability of capturing image of item being picked
Figure 7 shows the plot of this probability as a function of the time, with the time being expressed as a percentage of the overall gesture duration. We can see that the probability of getting a useful image is highest around the first 20-80% of the time of the picking gesture. In terms of absolute time, this window is approximately 1.2 seconds, which is a fairly wide window and thus instead of capturing a video, even if a single image is captured, the image of the item will be procured and thus saving the battery of the watch.
DISCUSSION
Our initial results are promising, but admittedly conducted under a contrived setting: with the items being placed on the shelves in our office lab. There are many aspects of shopper behavior in real-world stores that we will have to consider to make this vision an eventual reality.
- Additional Shopper Interaction Gestures
- Possibilities for Enhanced Sensor Fusion
- Additional Applications & Scenarios
CONCLUSION
Based on the studies conducted with users performing activities as in a normal grocery shopping in a simulated environment, this paper shows the practicality of using data sensed from the shopper’s personal devices and multiple other IoT devices deployed in the store to perform fine-grained shopper in-store analytics. Results from a study (conducted in a lab environment that crudely replicate the shelves of a grocery store) show that, given a trace of the sensing data and the images captured, we are able to (i) identify the shopper’s interaction with the products (picking gesture with an accuracy of 94%), (ii) the exact shelf from which the item was picked with 85% accuracy and also (iii) the exact item being picked with an accuracy of over 61%. We believe that novel analytics techniques that jointly harness such infrastructure-based IoT and shopper-specific wearable sensing data can lead to entirely new real-time, in-store, individual-specific shopping services and applications.
Source: Singapore Management University
Authors: Meeralakshmi Radhakrishnan | Sougata Sen| Vigneshwaran Subbaraju | Archan Misra | Rajesh Krishna Balan
>> Top Sensor based IoT Projects for Engineering Students
>> 200+ IoT Led Projects for Final Year Students
