ABSTRACT
Measuring and understanding the performance of mobile networks is becoming very important for end users and operators. Despite the availability of many measurement apps, their measurement accuracy has not received sufficient scrutiny. In this paper, we appraise the accuracy of smartphone-based network performance measurement using the Android platform and the network round-trip time (RTT) as the metric.
We show that two of the most popular measurement apps—Ookla Speedtest and MobiPerf—have their RTT measurements inflated. We build three test apps for three common measurement methods and evaluate them in a testbed. We overcome the main challenge of obtaining a complete trace of packets and their timestamps using multiple sniffers and frame-based synchronization. Our multi-layer analysis reveals that the delay inflation can be introduced both in the user space and kernel space.
The long path of sub-function invocations accounts for the majority of the delay overhead in the Android runtime (both Dalvik VM and ART), and the sleeping functions in the drivers are the major source of the delay overhead between the kernel and physical layer. We propose and implement a native measurement app to mitigate the delay overhead in the Android run-time, and the resulted delay inflation in the user space can be kept under 1.5ms for almost all cases.
BACKGROUND
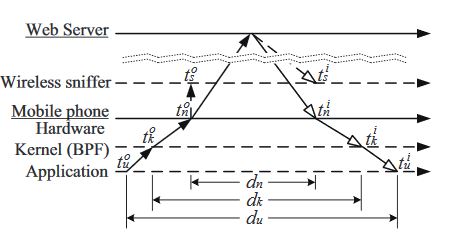
Fig. 1: Measurement flow for Android apps
To locate where the overheads are introduced, we perform multi-layer analysis by dissecting the delay overheads into several components. Back to the packet sending and receiving processes in Fig. 1, a packet needs to be delivered to the Linux kernel before it reaches the network (for the outgoing direction) or the app (for the incoming direction).
A MULTIPLE-SNIFFER TESTBED
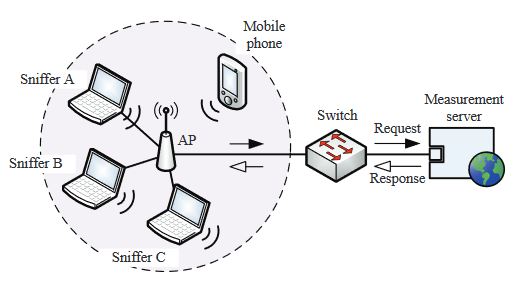
Fig. 3: The testbed setup where the packet sniffers, mobile phone, and wireless AP are placed within a distance of 0.5m
To evaluate the accuracy of measurement apps, we build a multiple-sniffer testbed in Fig. 3. The testbed consists of a measurement server (for local measurement only), which is equipped with a 1.86GHz Intel Core 2 Duo processor (E6320) and 2GB memory, and Netgear WNDR3800, an IEEE 802.11g wireless AP. The data rate of the WLAN is configured to 54Mbps.
OOKLA SPEEDTEST AND MOBI PERF
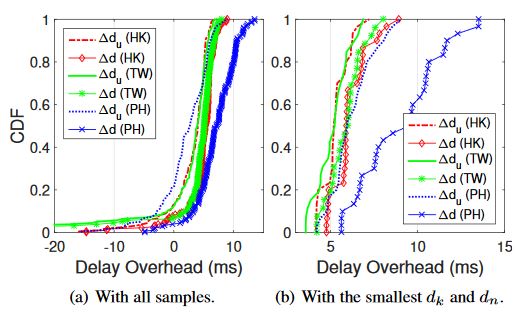
Fig. 5: CDF plots of ∆d and ∆du for Ookla Speedtest
To better understand how Speedtest inflates the network RTTs, we plot cumulative distribution functions (CDF) of delay over-heads in Fig. 5. We consider two cases: i) comparing all 6 samples of dk and dn with the reported RTT for each measurement, and ii) using the minimum dk and dn for a fairer comparison. For case (i) (as shown in Fig. 5(a)), although Speedtest has already returned the smallest sample as the final result, it still inflates the actual network RTTs for most of the cases.
TESTBED EVALUATION
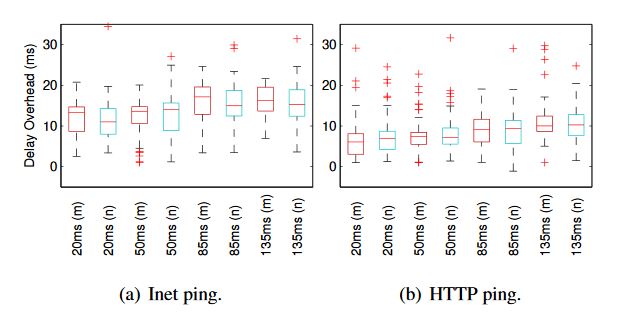
Fig. 6: Delay overhead comparison in box plot for phone G
To better visualize the effect of the two timing functions, we use box plots to present the data in Fig. 6. In each box-and-whisker plot, the top and bottom of the box are given by the 75th and 25th percentile, and the mark inside is the median. The upper and lower whiskers are the maximum and minimum, respectively, after excluding the outliers. The outliers above the upper whiskers are those exceeding 1.5 of the upper quartile, and those below the minimum are less than 1.5 of the lower quartile.
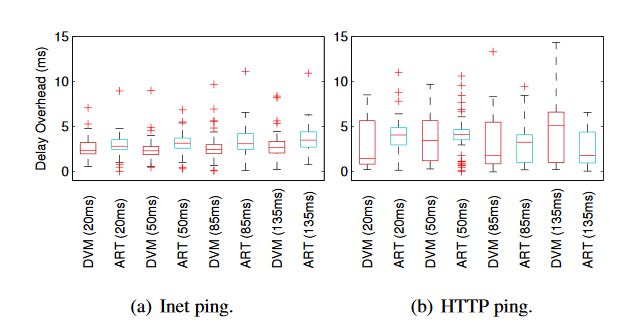
Fig. 7: Delay overhead comparison in box plot for phone G when different runtimes are adopted (red for DVM, and cyan for ART)
Fig. 7(b) clearly shows that for HTTP ping, both the interquartile range and the total range of delay overheads have been narrowed down significantly when ART is applied. Although the median ∆d in ART may be higher than those in DVM, we can conclude that ART can make the delay overheads more stable for HTTP ping. However, as depicted in Fig. 7(a), Inetping has higher ∆d with ART. This observation can also be confirmed by Table 5, where the delay overheads measured by W1-W3 are usually higher than the other three phones.
DISCUSSION
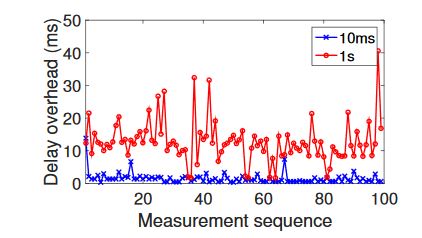
Fig. 13: Delay overheads in time series when using ping with packet sending intervals of 10ms and 1s
However, this approach is too costly for other less delay-sensitive apps. For the delay overhead due to energy efficiency mechanisms, our approach of keeping the WNIC awake can also improve the app’s latency performance. Fig. 13 plots the delay overhead experienced by ping measurement for two packet sending intervals (10ms and 1s).
RELATED WORK
Our work shares similar analysis methodology in our previous work, which appraised the accuracy of browser-based measurement methods in fixed network. However, the methodology in cannot be applied straightly to the mobile network measurement. We therefore design and build a new test-bed to reliably capture packets in the air medium. Our evaluation results based on the three test apps developed by ourselves was previously reported.
CONCLUSIONS
In this paper, we appraised the accuracy of measurement apps in Android phones. We overcame the main challenge of obtaining accurate packet timestamps from the wireless medium and setup a reliable wireless test-bed. Both Internet experiments and test-bed evaluation showed that the RTTs measured by the apps with different methods are significantly inflated. After conducting careful investigations through multi-layer analysis, we identified the delay overhead introduced by the run-time virtual machine is significant and asymmetric in the send and receive directions. Our analysis further showed that the long path of sub-function invocations in run-time accounts for the overhead in the user space, while the sleeping features in the driver cause the kernel-phy delay inflation.
Source: Singapore Management University
Authors: Weichao LI | Daoyuan WU | Rocky K. C. CHANG | Ricky K. P. MOK