ABSTRACT:
This project was about building a line graph utility, a software module that should read map data from a PostGIS database and transform that information into a line graph (edge based graph) that the calling software could use to perform routing decisions.
This outer calling application is part of a project (by an anonymized company) for flexible public transportation, that is meant to manage and direct a fleet of vehicles to where the customers actually are, instead of idling at bus stops.
The software module should take different kinds of restrictions and conditions into account when building the line graph, to reflect the actual traffic situation. That can be turn restrictions, traffic signs, inclination, or conditions such as temporary hindrances, time of day. Some are static, but others vary dynamically and the state is to be found in the database.
This study has found a set of tools that aids in the transformation of OpenStreetMap data into a PostGIS database; for building the topology of the map; querying the database; and data structures for representing the graph and line graph.
The result of the project is a piece of working software that can return a line graph as a Boost graph with some restrictions taken into account, but it has not yet implemented them all, and more specifically, it does not handle conditional restrictions yet. There remains a good deal of work to implement all that complex logic.
SNIPPETS
Graph theory:
There are good lecture notes such those from Tampere University of Technology and Univerity of Turku (both happen to be Finnish) and a good text book by Reinhard Diestel are available to get into this subject. One does not need to understand all the concepts, but be familiar with some basic definitions and notations.
Map Routing:
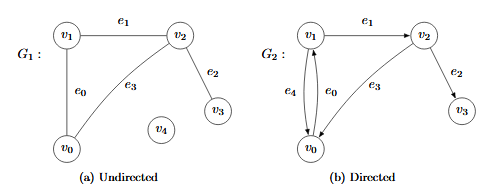
For graphs as those described above, there exists basic algorithms such as Dijkstra and bidirectional search , or more goal directed such as A*, that tries to find the shortest path from vertexs (source) to vertext (target). To do that, each edge needs to be associated with a length. That is, the metric is distance.
Map Data:
One needs to have good map data as the source for building these data structures and apply smart algorithms on. With poor data it does not matter if one has smart algorithms. A said earlier, a race in route planning started with the public release of previously proprietary data. About the same time OpenStreetMap also began, which is an crowd-sourced project, meaning that anyone interested can be a cartographer and contribute with map data.
METHODOLOGY
The methodology used in this project:
- Theory studies.
Graph theory.
Maps and routing. - Analysis.
Tools
Design. - Development (incremental).
Coding.
Testing. - Documenting.
- Evaluation.
Behaviour and Test Driven Development:
Behavior Driven Development tests usually have the structure:
Scenario→Given→When→Then, written with words to describe the steps. An example in the Gherkin language is shown in listing 3.1.
Database:
The database of choice, and in the requirements of the project, is PostgreSQL3, with the extension PostGIS4 which gives the database spatial and geographic capabilities, which are needed to simplify working with maps and such, for example when needing to measure distances in different projections.
How to set up the database with users and passwords and such are not given in this report, but it is not so hard. When setting up databases one can interact via either the command line or a graphical user interface, GUI such as pgAdmin3.
Configuration:
The module should be configured by a settings file, written as json . Settings can be related to the database such as host address, table names etc; or it can be configuration of costs for the routing such as speed limits, traffic lights, turn restrictions.
Build Graph:
The requirements said that the “Boost Graph Library (BGL)”should be used for representing the graph and for returning the line graph structure for routing back to the calling application.
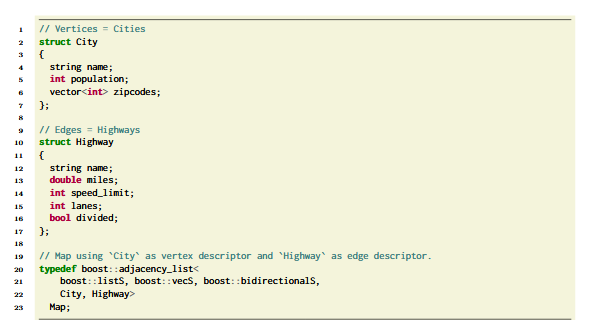
The most space efficient way of representing a sparse graph is an adjacency list, and the BGL has such a data structure. Using template arguments one can configure what kind of data structures to use for the lists of edges and vertices , and the data structures to use for edges and vertices, and if the graph is directed or undirected.
IMPLEMENTATION
The software module called the “Line Graph Utility”,(LGU), that should be the outcome of this project, is sequential in nature. The complete specification is available , but here is an outline of the main use case.
- The using application calls the LGU’s get_directed_line_graph().
- LGU queries the PostGIS database and builds a graph from the road network.
- LGU builds a directed line graph from the previous step (i.e. it converts nodes to edges and assigns weight to those edges based on road signs and other elements which are present in the nodes).
- get_directed_line_graph() returns a directed line graph structure which is based on a C Boost graph structure to the function caller.
Design:
The sequential nature of the module, with a few easily identifiable objects, lead to no big design process was deemed necessary. Taking an object oriented approach, it is easy from the above list to identify configuration (and configuration reader); edges; vertices; database; topology; restrictions; costs; graph (and graph builder and transformer); line graph.
Project Structure:
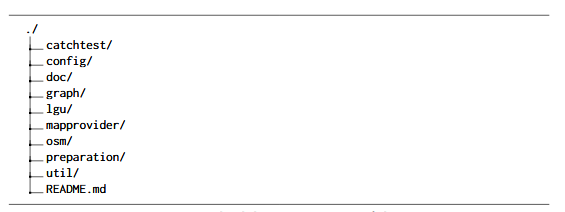
Apart from the packages above, there are directories in the project to support testing, setting up and documentation. This gives the project a basic directory structure as shown in listing 4.1.
Development Environment:
Development of the project and the coding has taken place in Eclipse Luna 4.4.2. The build system is the default in Eclipse on Linux, generating makefiles.
- Compiler flags:
std=c++11
DBOOST_LOG_DYN_LINK
O0
g3
Wall
c - Linker flags:
lboost_log
lboost_log_setup
lboost_thread
lboost_system
lpthread
lpqxx
lpq
RESULTS
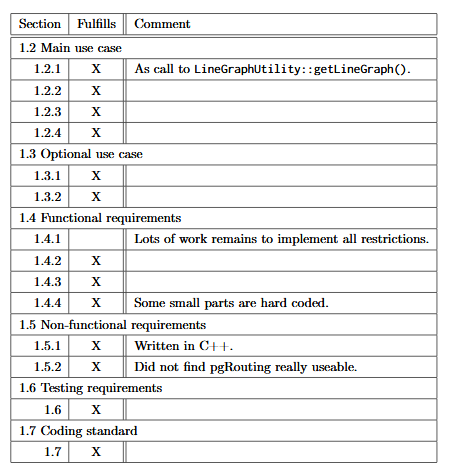
The software module developed in this project does not fulfill all requirements, in that it does not handle conditional restrictions at all, and not all implemented restrictions are handled correctly, see section 5.1 below.
Specification Fulfillment:
Visual Examination:
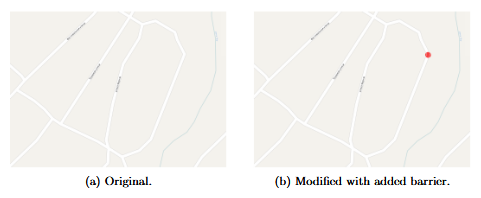
Maps are easy to visualize, and a great number of tools exist to work with map data. Figure 5.1 shows a piece of a map over Mikhailovsk. In order to test if the handling of restrictions work, modified maps have been created. JOSM 1 is a tool for manipulating OSM data.
Performance:
There were soft real time requirements in the specification, but they were not specified more than that. But it is interesting so find out how long it takes to fetch a line graph,
built on demand by the software module.
RESULTS
As the project does not fulfill all requirements and did not finish on time, it was not all that successful. The reason for not meeting the specification is that I ran out of time, partly due to the specification was supplied more than two weeks late, and partly due to the complexities with handling restrictions.
It would be possible to continue development, most on finding good ways to handle conditional restrictions. From my horizon, I still think that the best solution would be to adapt an existing solution that has been developed and refined by many people through many years. Perhaps using OSRM together with a PostGIS database as demonstrated here: https://www.mapbox.com/blog/osrm-using-external-data/.
Source: Mid Sweden University
Author: Jonas Bergman
