ABSTRACT
Structural dynamics engineers are asked to make measurements for distinguishing differences between two structures. A frequent approach is to compare the modal parameters by change in Modal Assurance Criterion behaviour which focuses only on the Eigen values and Eigen vectors.
A Graphical method of comparison was found for simple structures, which considers the spatial distribution of the entire frequency response spectrum. Point compliances represented by a color scale are measured at short intervals along reference line on a structural edge and the result is a three dimensional representation of dynamic behaviour. Experiments were conducted and MATLAB toolbox along with Graphical User Interface for compliance maps was built.
THEORY OF MODAL ANALYSIS
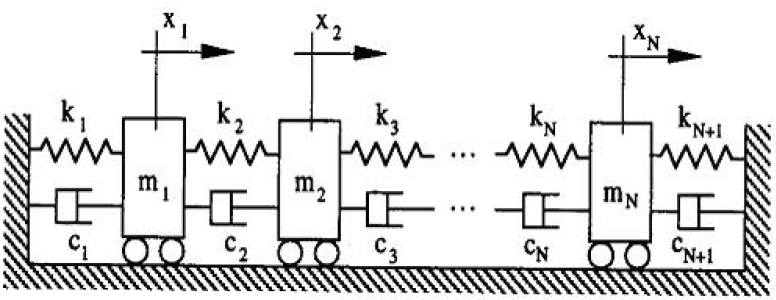
Figure 3 .1. Example of a model with ‘N’ degrees of freedom
Figure 3.1 representing a viscously damped system described by its spatial mass, stiffness and damping properties. A total of N coordinates xi (t) ( i =1,2,3…,N) are required to describe the position of the N masses relative to their static equilibrium positions and the system is said to have N degrees of freedom.
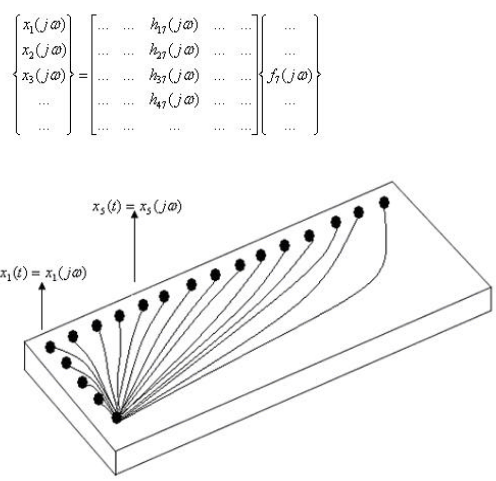
Figure 3.3. Measurements of FRFs on a structure
Modal testing requires that FRFs be measured from at least one row or column of the FRF matrix. Modal frequency and damping are global properties of a structure, and can be estimated from any or all of the FRFs in a row or column of the FRF matrix. On the other hand, each mode shape is obtained by assembling together FRF numerator terms (called residues ) from at least one row or column of the FRF matrix.
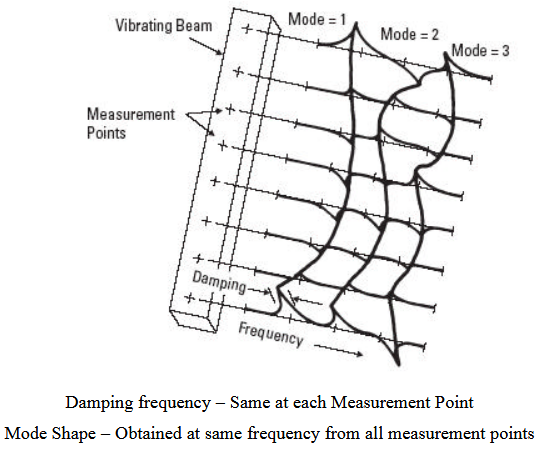
Figure 3 . 6. Concepts of modal parameters
Frequency responses can be measured independently with single – point excitation or simultaneously with multiple-point excitations. The mode shapes as a whole are also global properties of the structure, but have relative values depending on the point of excitation and scaling and sorting factors. On the other hand, each individual modal coefficient that makes up the mode shape is a local property in the sense that it is estimated from the particular measurement associated with that point as shown in figure 3.6.
EXPERIMENTATION
The ski was divided into 48 nodes with 16 nodes on each vertical line as shown in Figure 4.9. The experimental modal analysis data was measured at 48 different locations by roving hammer method. After obtaining the FRF data in the form of UFF files they were converted into the form of FRF matrix by using the functions supplied by Saven EduTech® and these functions are explained in the chapter MATLAB® tool box.
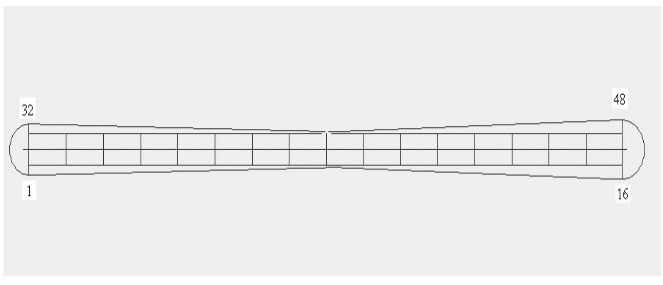
Figure 4.9. Location of nodes on the Ski
As shown in the Figure 4.8 a ski was hanged free – free conditions with fixtures and accelerometer was attached to Dynamic Frequency Mobilyzer® at the input channel 2. The impact hammer was connected to the Dynamic Frequency Mobilyzer® through the cable at the input channel 1. The FRFs were measured by exciting the structure with the help of impact hammer and the response was measured with the help of accelerometer.
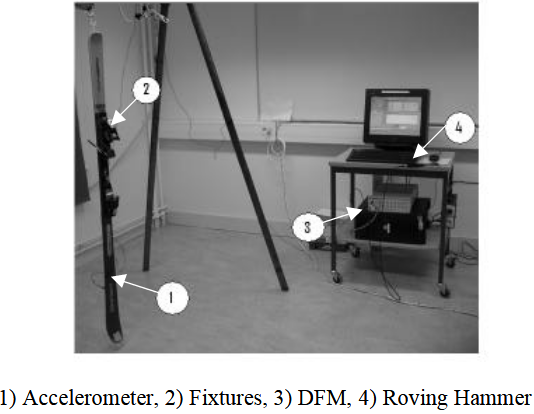
Figure 4.8. Experime ntal setup for ski FRF measurement
RESULTS AND DISCUSSION
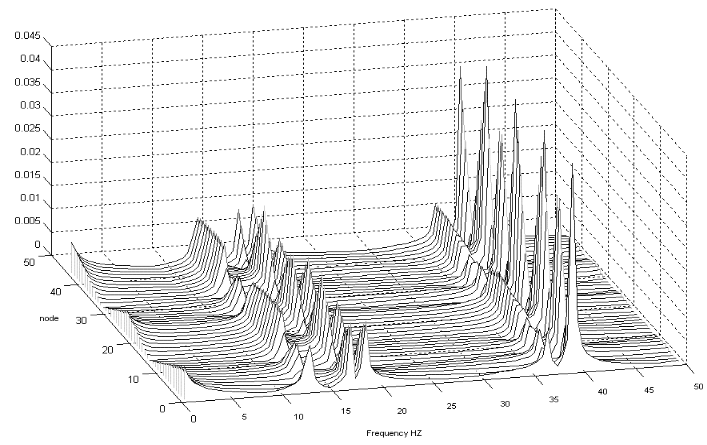
Figure 5.4 Waterfall diagram of simulated rectangular plate after the attachment of mass tuned damper
The Water fall diagram after the mass tuned damper was attached to the structure in consideration can be observed in Figure 5 .4.
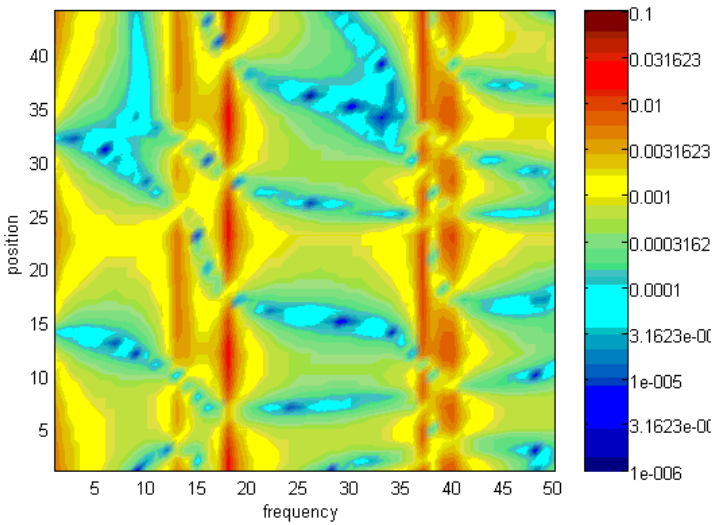
Figure 5.5. Compliance map of simulated rectangular plate without mass tuned damper
A clear red vertical stripe is observed at about 18.7 Hz as depicted by Figure 5.5. This stripe is observed to be split into two vertical stripes with a decrease in the color intensity indicating amplitude attenuation which is achieved by the attachment of mass tuned damper. Anti – resonance occurs at the tuned frequency and the vibration is decreased by a large fraction.
CONCLUSION AND RECOMMENDATIONS
Structural dynamics engineers are frequently ask ed to make measurements for the purpose of distinguishing differences between two structures or changes within the same structure. A frequent approach is to compare the modal parameters by following a shift in modal frequency or a change in modal assurance criterion between two sets of Eigen vectors. But the weakness of this approach is that it ignores the total dynamic behaviour and focuses only on the Eigen values and Eigen vectors.
This thesis is an Extension work of the new visualization tool to mark the differences between two structures. Compliance maps were drawn for various skis. A MATLAB program with a graphical user interface was designed for plotting compliance maps.
A visualization tool has been shown for efficiently comparing the dynamic properties of structures. This technique requires the collection of a series of high quality, closely spaced FRFs over some length or area. It permits quick graphical comparisons, allows the identification of mode shapes for simple structures, and offers additional insight on the spatial and spectral distribution of modal parameters and general dynamic behaviour.
Source: Blekinge Institute of Technology
Authors: Gorrepati Haribabu | Chinthalapalle Chandrasekhar Reddy
>> Matlab Project Topics List with Free Pdf for Mechanical Students
>> Automobile based Matlab Project Topics with Free Base Papers Downloads