ABSTRACT
Satellites commonly use onboard digital cameras, called star trackers. A star tracker determines the satellite’s attitude, i.e. its orientation in space, by comparing star positions with databases of star patterns. In this thesis, I investigate the possibility of extending the functionality of star trackers to also detect the presence of resident space objects (RSO) orbiting the earth. RSO consist of both active satellites and orbital debris, such as inactive satellites, spent rocket stages and particles of different sizes.
I implement and compare nine detection algorithms based on image analysis. The input is two hundred synthetic images, consisting of a portion of the night sky with added random Gaussian and banding noise. RSO, visible as faint lines in random positions, are added to half of the images. The algorithms are evaluated with respect to sensitivity (the true positive rate) and specificity (the true negative rate). Also, a difficulty metric encompassing execution times and computational complexity is used.
The Laplacian of Gaussian algorithm outperforms the rest, with a sensitivity of 0.99, a specificity of 1 and a low difficulty. It is further tested to determine how its performance changes when varying parameters such as line length and noise strength. For high sensitivity, there is a lower limit in how faint the line can appear.
Finally, I show that it is possible to use the extracted information to roughly estimate the orbit of the RSO. This can be accomplished using the Gaussian angles-only method. Three angular measurements of the RSO positions are needed, in addition to the times and the positions of the observer satellite. A computer architecture capable of image processing is needed for an onboard implementation of the method.
METHOD
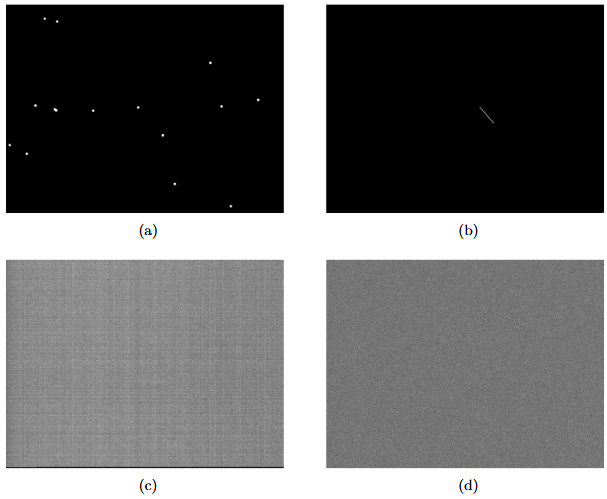
Figure 2.1: The components of the synthetic images used in the testing
Figure 2.1: The components of the synthetic images used in the testing. The contrast is exaggerated for clarity. The images show: a) the star projection around the big dipper constellation (the stars are exaggerated in size), b) an RSO visible as a line, c) the banding noise from the camera and d) gaussian noise.
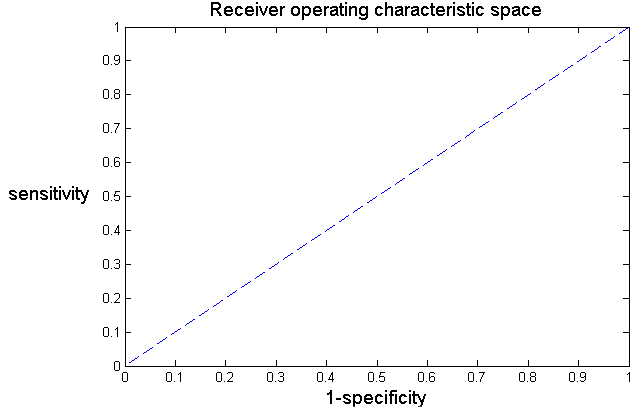
Figure 2.3: The space of the sensitivity and specificity metrics
Figure 2.3: The space of the sensitivity and specificity metrics. Note that the x-axis shows 1 – specificity (one minus specificity). The blue line corresponds to a classifier that is no better than random guessing. In order to make sense of the sensitivity metric, a specificity of 1 was thus required. This ensured that there were no false positives, and no false RSO detected in the noise. The algorithms were first trained to have a specificity of 1, secondly to increase their sensitivities. This means, in figure 2.3, moving along the y-axis as close to the upper left corner as possible.
IMAGE ANALYSIS THEORY AND ALGORITHMS
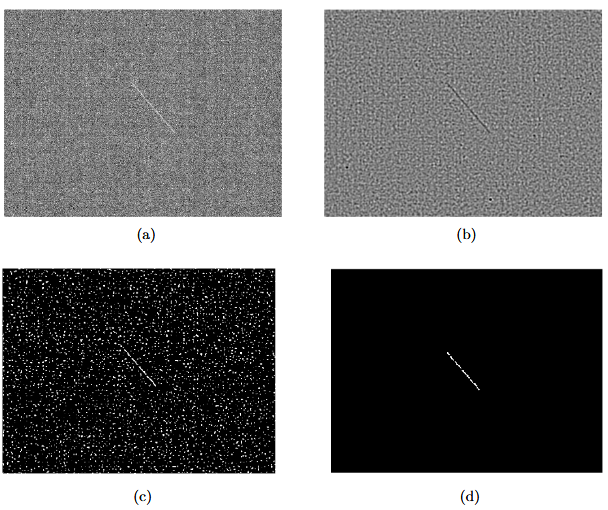
Figure 3.1: An example of a line detection algorithm
Figure 3.1: An example of a line detection algorithm. The images show: a) the original image, with increased contrast for clarity, b) the image filtered with the Laplacian of Gaussian, c) the filtered image after thresholding, producing a binary image, d) only the largest objects from the thresholded image.
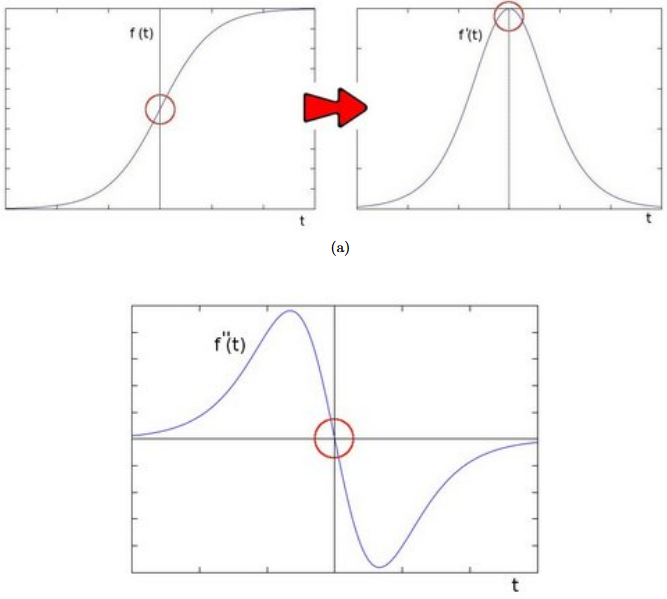
Figure 3.3: The upper left portion of figure (a) shows the intensity function in any direction
Figure 3.3: The upper left portion of figure (a) shows the intensity function in any direction over a high-contrast region of the image. The upper right image shows the derivative of that function. Figure (b) shows the second derivative of the intensity function. The red circle shows the location of an edge.
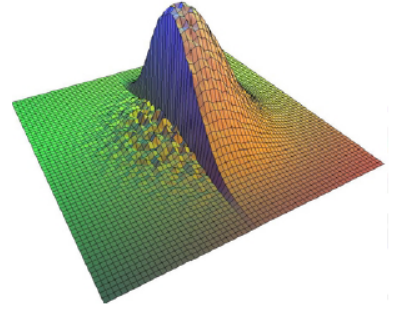
Figure 3.4: An example of a kernel of the bilateral filter. The standard Gaussian shape is modified by the intensities; here, a high-contrast edge in the image explains the differences between the two sides of the kernel
The bilateral filter, like the Gaussian filter, computes a value for the central pixel in the kernel by computing an average of nearby pixels. Pixels further away from the center take on smaller weights in this calculation. However, the bilateral filter also assigns weights due to differences in intensities between pixels. These weights can also follow a normal distribution. This, like the Kuwahara filter, makes the bilateral filter edge-preserving. An example is shown in figure 3.4.
RESULTS
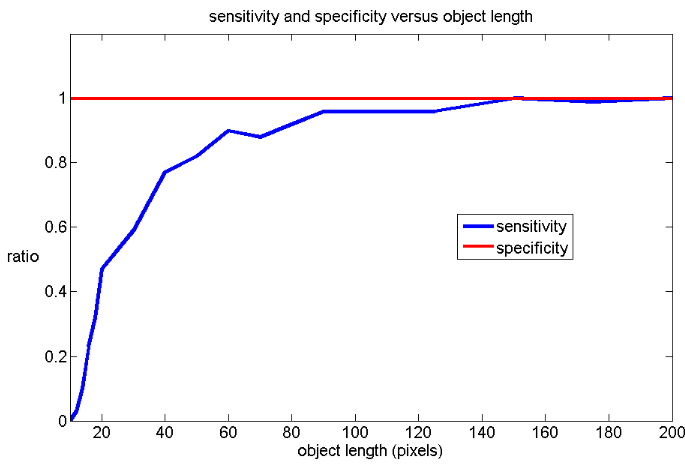
Figure 4.1: Varying the length of the line in the images. As the length increases, so does the sensitivity
The length of the line was varied as shown in figure 4.1. It can be seen that the sensitivity is high for lengths higher than 50 pixels, and that it drops sharply when the length is decreased.
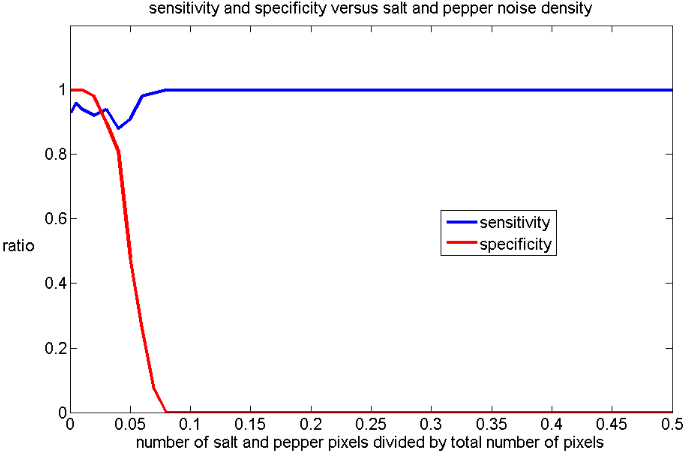
Figure 4.5: Varying the salt and pepper noise density of the images. As the density increases, the specificity decreases
The salt and pepper noise density of the image was varied as shown in figure 4.5. It can be seen that the specificity is high for a density of 0.01 and lower, and drops rapidly to zero when the density is increased. The increase in sensitivity for a density of around 0.07 and higher is due to the algorithm incorrectly detecting lines in the noise.
DISCUSSION
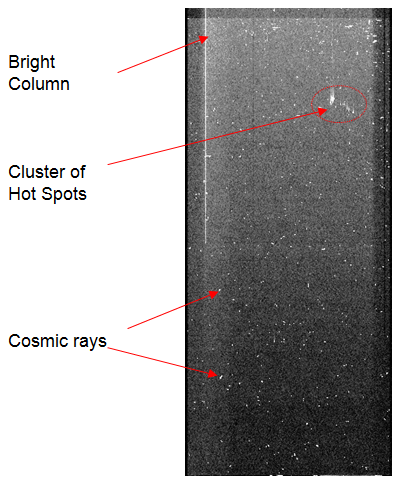
Figure 5.1: Additional noise: Bright columns, cluster of hot spots and cosmic rays
There are many additional sources of noise that can appear when operating CCD’s and CMOS devices in space. Some examples of this can be seen in figure 5.1. Bright columns appear as vertical streaks in the image. Hot spots are pixels with high dark current, meaning consistently high intensity. Cosmic rays result in temporary clusters of high intensity. Possible coping strategies include calibration or preprocessing with low-pass filters to increase the local signal-to-noise ratio.
ORBIT DETERMINATION
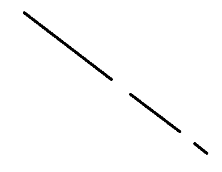
Figure 6.1: Three exposures of an RSO passing by in the camera’s field of view. The images are in sequence from left to right
Consider figure 6.1. One RSO is detected in three separate images in sequence from left to right. From the image it is unclear if the RSO is moving away from the observer or towards it. However, the angular positions of the endpoints of the detected lines can be calculated. Combining this information with the constraints of orbital motion and the positions of the observer at the times of observations, a preliminary orbit of the RSO can be computed.
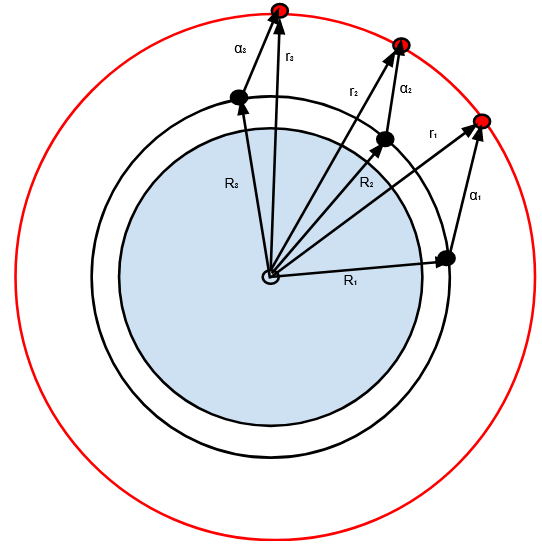
Figure 6.3: The system of vectors when using a geocentric coordinate system
Figure 6.3: The system of vectors when using a geocentric coordinate system. The angles of the RSO are measured from a star tracker aboard a satellite. The red object is an RSO and the black object is the satellite doing the measurements. The vectors correspond to the known times ( t1, t2 and t3 ) respectively. Note that both orbits may be elliptic instead of circular.
CONCLUSIONS AND FURTHER RESEARCH
For images taken with star trackers, the presence of resident space objects can be detected using image analysis algorithms. Their angular positions in declination and right ascent can also be determined. This data can be used to do an imprecise preliminary orbit determination with the Gaussian angles-only method. Three measurements with small time differences are needed, combined with the times of detection and the positions of the observing satellite.
The detection algorithm should be adjusted and calibrated depending on the expected intensity of the RSO to be detected and the type of noise. If specifications about the RSO were available, such as the reflectance, the distance from the camera and the integration time, their line intensities could be modelled. The noise could also be modelled depending on sensors, optics and operational requirements. For lines with low local signal-to-noise ratio, the detection algorithm should be based on the Laplacian of Gaussian filter. For lines with high local signal-to-noise ratio, a less computationally intense algorithm could be used. If the local signal-to-noise ratio is very low, all of the tested algorithms’ sensitivities will be very low. More sophisticated methods, which are much more computationally intense, might perform better.
It is difficult to say how technically feasible the solution is. In terms of computational intensity, the bottleneck should be the image analysis. The Laplacian of Gaussian filter is separable but requires a fairly large kernel size. The orbit determination calculations should be less costly. Thus, a computer architecture capable of image processing is needed for an on board implementation. Considering the power, size, weight and evolution of modern smartphones, this problem should be possible to solve.
Source: Uppsala University
Author: Karl Bengtsson Bernander
>> Matlab Project Pdf Free Downloads for Aeronautical Engineering Students
>> 50+ Matlab projects for Digital Image Processing for Engineering Students