ABSTRACT
To improve design and reliability, extensive efforts has been devoted to understanding damage and failure of materials and structures using numerical simulation, as a complement of theory and experiment. In this thesis, peridynamics is adopted to study fatigue and dynamic failure problems.
Fatigue is a major failure mode in engineering structures. Predicting fracture/failure under cyclic loading is a challenging problem. Classical model cannot directly be applied to problems with discontinuities. A peridynamic model is adopted in this work because of important advantages of peridynamics in allowing autonomous crack initiation and propagation. A recently proposed peridynamic fatigue crack model is considered and improved in terms of computational efficiency and numerical stabilities.
We validated the fatigue crack model by comparing simulation results of a modified compact tension test with experiments. The proposed improvements add the fatigue limits to the propagation phase. We demonstrate that the model simulates all three phases of fatigue failure (initiation, propagation, and final failure) with an example in which a fatigue crack sinks into a cutout and re-initiates from a different location along the cutout, grows, and lead to final failure of the structure. Convergence studies show that the peridynamic results are correct once the nonlocal size is smaller compared with the size of relevant geometrical features.
In the second part of this thesis, a 3D peridynamic model for cubic crystalline elastic and brittle materials is proposed. We use the model to simulate the Edge-on impact test of a transparent ceramic material, AlON. Experiments show that in ALON, damage transitions from a fast failure front (faster than the shear wave in the sample) to much slower localized cracks.
Using the peridynamic model we explain, for the first time, the reasons behind this transition, and why failure front moves faster than the shear wave speed in the material. We also use the polycrystalline peridynamic model to predict crack nucleation sites in a Ni-based superalloy. Peridynamic results for a synthetic polycrystalline sample under tension are compared with finite element simulations. Results show that the model introduced captures the strain distribution and all strain concentration sites predicted by the FEM model, and in addition, it allows for initiation, growth, and interactions of cracks.
PERIDYNAMIC THEORY
Peridynamics is a reformulation of the classical continuum mechanics equations that allows for a natural treatment of discontinuities in the solution by employing the concept of nonlocal interactions. Integration, rather than differentiation, is used to compute the total force density acting on a certain material volume, and deformation gradients are not used in the formulation. Peridynamics differs from other nonlocal methods such as those described by Eringen, Kunin, and Rogula, or those reviewed by Baˇzant and Jir ́asek, for at least two fundamental reasons:
- The deformation gradient and strains (spatial derivatives of displacements) are not used in peridynamics. Other nonlocal methods average strains over the nonlocal region. Spatial derivatives of the displacement field become undefined when discontinuities, like cracks, emerge and this requires special treatment and algorithms in models that employ such derivatives in their formulation.
- Damage is introduced in the peridynamic method at the microlevel in the constitutive model for the peridynamic bonds between material points. When the relative elongation of the bond reaches a failure criterion related to the material‘s fracture energy, the bond breaks. Fracture surfaces result autonomously as a consequence of this definition and dealing with multiple interacting cracks of arbitrary shapes in complex geometries becomes as easy as dealing with a single straight crack. In this way, peridynamics integrates damage and fracture under a single model for material failure.
MODELING THE EVOLUTION OF FATIGUE FAILURE WITH PERIDYNAMICS
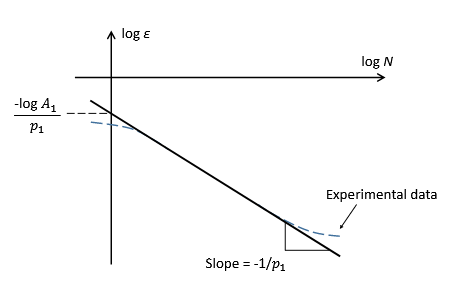
Figure 3.1: Calibrating constants in peridynamic fatigue law for crack initiation phase.
In log-log, this represents the equation of a straight line, and the two parameters A1 and p1 are found by enforcing the match between this straight line and a similar straight line coming from an S-N curve in terms of strains (see Fig. 3.1). Once A1 and p1 are found, we can compute N1 needed for first nucleation. Notice that here we assume that the cyclic strain range is independent of the cycle number N.
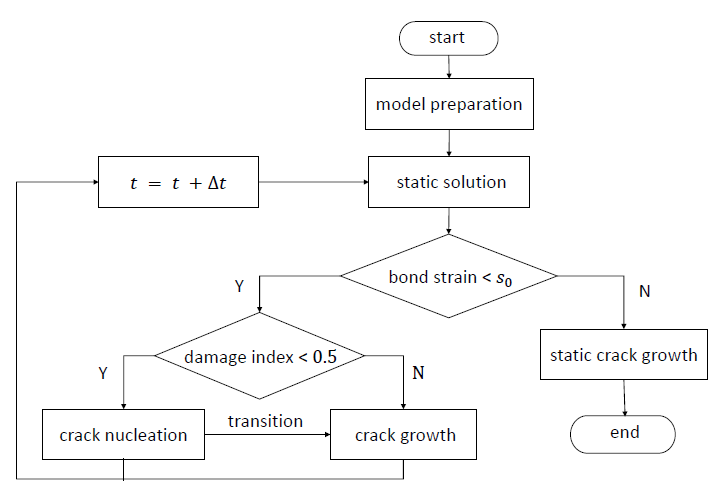
Figure 3.3: Flowchart of peridynamic fatigue simulation, with the three phases: crack nucleation, growth, and nal failure (last phase controlled by the mechanisms of static crack growth).
As shown in a owchart in Fig. 3.3, peridynamic simulation of fatigue cracking starts from initialization (mesh generation, family search, and boundary conditions application), solving static problems, followed by fatigue crack (includes crack nucleation phase and crack growth phase) and/or static crack growth simulation. Because previous section discussed the bond damage in three phases, this section focuses on the numerical implementation for solving peridynamic static problems, calculating the peridynamic J-integral and stress intensity factor K.

Figure 3.8: Parametric study to determine the value for Dmax. Here Dmin is set to 0.01 and m = 4.
To determine the value of Dmax, we set Dmin to 0.01 and use the same time step as above and perform several simulations with different Dmax values. We find significant difference (see Fig. 3.8) in the fatigue damage produced by various Dmax parameters. As Dmax increases from 0.1 to 0.4, the thickness of the damage region developing from the pre-crack increases dramatically. This thickening of damage happens because the time step is too large and it leads to sudden reduction of remaining life for many bonds around the crack tip.
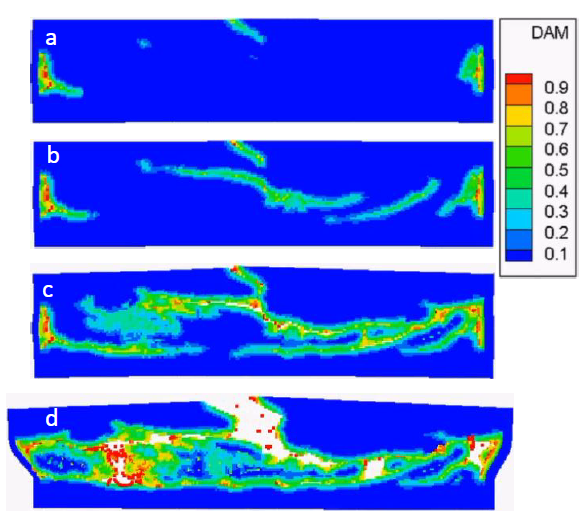
Figure 3.19: Snapshots of damage results of the two phases material.
Snapshots of the evolution of damage at 8000, 14000, 20000, and 22000 cycles are shown in Fig. 3.19. Four crack initiation sites can be seen in Fig. 3.19a, including two caused by material discontinuities and two near the boundaries where the loading is applied. In Fig. 3.19b we see that new cracks initiate and growth along the interface of the two materials and within the superconducting filaments. Complex crack interactions, like crack coalescence, can be observed in Fig. 3.19c. Final failure occurs as shown in Fig. 3.19d.
DYNAMIC BRITTLE FRACTURE OF ALON
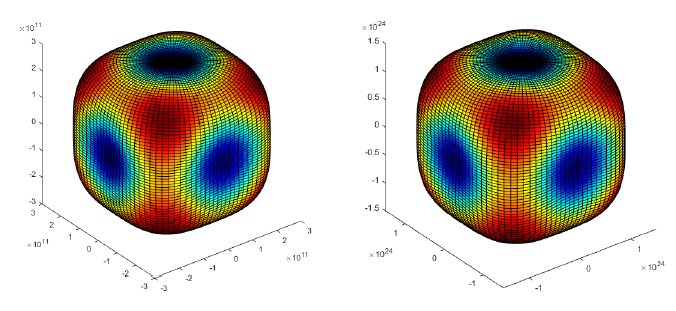
Figure 4.1: The tension coefficient surface for single-crystal AlON (left).
Figure 4.1: The tension coefficient surface (effective modulus along different orientations) for single-crystal AlON (left). The variation of the micromodulus function with orientation (right). Results produced by matching of strain energy densities for two di erent simple deformation modes.
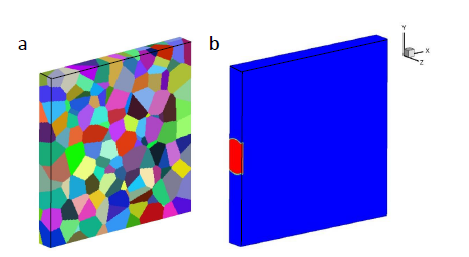
Figure 4.6: (a) The 3D computational polycrystalline sample (side view), which has 190 grains, and (b) the region (in red) of applied loading (with 4 GPa of sudden pressure).
However, we will scale the applied loading so that the applied stress from the impact is similar to the ones reached in the experiments. Thus, we use a computational model with around 190 grains, shown in Fig. 4.6a. We apply loading over a region to mimic a cylindrical impactor with radius 1.2 times of the sample thickness, similar to the one in EOI experiment (see Fig. 4.6b).
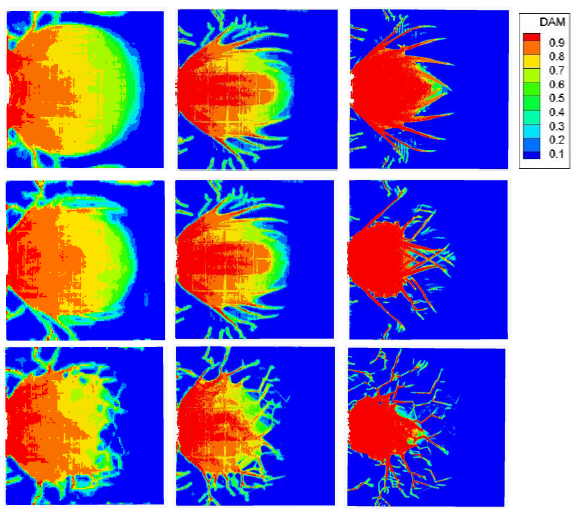
Figure 4.7: Damage index at 0.3 s on the front surface of the sample.
Figure 4.7: Damage index at 0.3 μs on the front surface of the sample. Horizon is 2/5, 1/5, and 1/10 of the average grain size (200 μm) for each column. From top to bottom, each row shows results with an isotropic, single grain, and polycrystalline model, respectively.
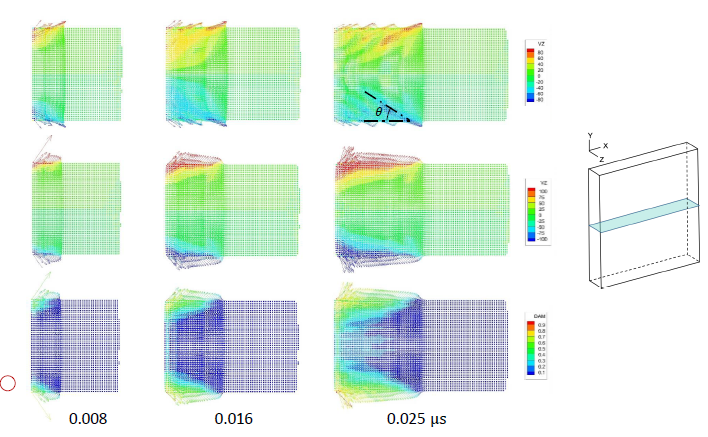
Figure 4.11: Velocity vectors in the xz-cross-section for an isotropic material.
Figure 4.11: Velocity vectors in the xz-cross-section for an isotropic material with (bottom two rows) or without (top row) damage showing time evolution of wave propagation and damage. The red circle in the lower left corner shows the horizon size ( δ = 20μm) relative to the sample size.
PREDICTION OF CRACK NUCLEATION SITES OF A CUBIC CRYSTAL SUPERALLOY
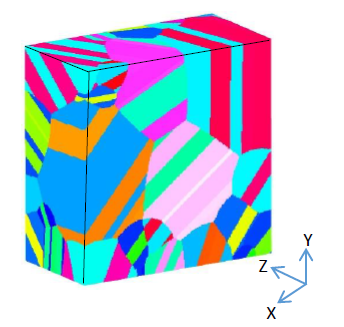
Figure 5.3: Microstructure of the synthetic model, which has 179 grains.
We consider the following setup for analyzing the strain concentration sites in polycrystalline materials: a synthetic Rene 88DT model with 100 x 100 x 50 μm as shown in Fig. 5.3. This model has 179 grains with random orientation and most of them are twin grains. Rene 88DT has FCC microstructure, twins in this type of materials share Σ3 boundary, which is 60o rotation about the direction.
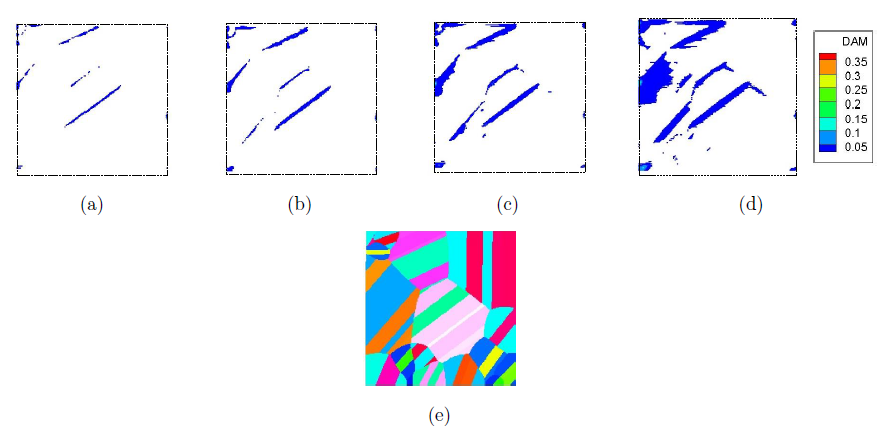
Figure 5.14: Damage maps (top row) at 0.02, 0.04, 0.06, 0.08 million cycles, and microstructure (bottom row) of the surface (Z = 0 μm).
Boundaries of the sample are illustrated by lines. Damage results are consistent with strain results in Figure 5.14 because the model is linear elastic. Notice that most damaged nodes have damage index smaller than 0.05 throughout the evolution simulated in our fatigue tests. However, on some of the boundaries, we find locations with significantly larger damage index, near 0.35. These sites approach the development of a micro-crack.
FUTURE WORK
There are a few aspects of future work:
- Comparing with local methods, peridynamic simulation is computationally costly. Computational efficiency can be improved by using graded mesh like finite element method and variable horizon size. Using these two techniques, we can use much less number of the peridynamic nodes to perform the simulation, especially for structural components with holes and notches.
- Another option to improve the computational efficiency of peridynamic static simulation is using several models with different discretization density. The simulation starts from solving the coarse model with lease number of material points which requires, and then we can mapping the node displacement to a finer model. Repeat this procedure until desirable accuracy obtained.
- Fiber reinforced composites (FRC) are widely used in engineering because of its high strength at low weight. Failure in FRC is complex which includes inter-layer and intra-layer failure. Combining existing peridynamic FRC models with static and fatigue simulation discussed in this thesis, we expect to capture the complex failure phenomenon in laminate materials.
Source: University of Nebraska
Authors: Guanfeng Zhang