ABSTRACT
The peel resistance of four adhesives (“J-B Weld” by J-B Weld (adhesive A), 3 M Scotch-Weld DP 125 Gy (adhesive B), Loctite PL Premium (3x) Construction Adhesive (adhesive C), and Henkel Hysol EA9394 (adhesive D)) is investigated for their bonding performance of a styrene‐ethylene/butylene‐styrene–carbon black (SEBS–CB) composite membrane used in structural health monitoring (SHM) applications.
Tests are performed on membrane samples bonded on four common structural materials, namely aluminium, steel, concrete, and fiberglass, to obtain the peel resistance of adhesives. Results show that adhesive B has the highest strength for aluminium, steel, and fiberglass substrates, and that adhesive C has the highest strength for the concrete substrate.
The performance is also evaluated versus adhesive cost, a critical variable in SHM applications. Here, adhesive C performed best for all substrates. Lastly, membrane residuals resulting from the peel tests are compared. Tests show that Adhesive B resulted in the highest residual percentage for aluminium, while adhesive C performed better for all other substrates. However, membrane residuals for adhesive C do not show a positive correlation with the peel resistance.
MATERIAL AND METHODS
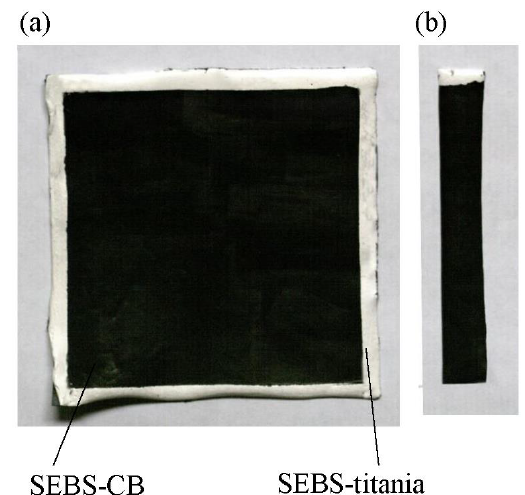
Figure 1 (a) A 10 cm x 10 cm sensing membrane; and (b) a typical 1.3 cm x 9.5 cm sample cut from the fabricated membrane.
Sensing materials were fabricated following a previously established fabrication methodology. Briefly, the SEBS-titania composite dielectric was fabricated using a solution casting method. SEBS pellets were dissolved in toluene, and titania particles (Sachtleben R 320 D) were added and dispersed using sonication. The resulting solution was cast on a 10 cm x 10 cm glass plate and kept at room temperature for 5 days to allow toluene to evaporate.
The electrodes were fabricated by mixing CB particles (Printex XE 2-B) into an SEBS solution to produce a conductive paint, which was sprayed onto both surfaces of the dielectric to constitute the sensor. Figure 1(a) shows a picture of the resulting sensor. Figure 1(b) shows a picture of a typical sample cut from the fabricated sensor.
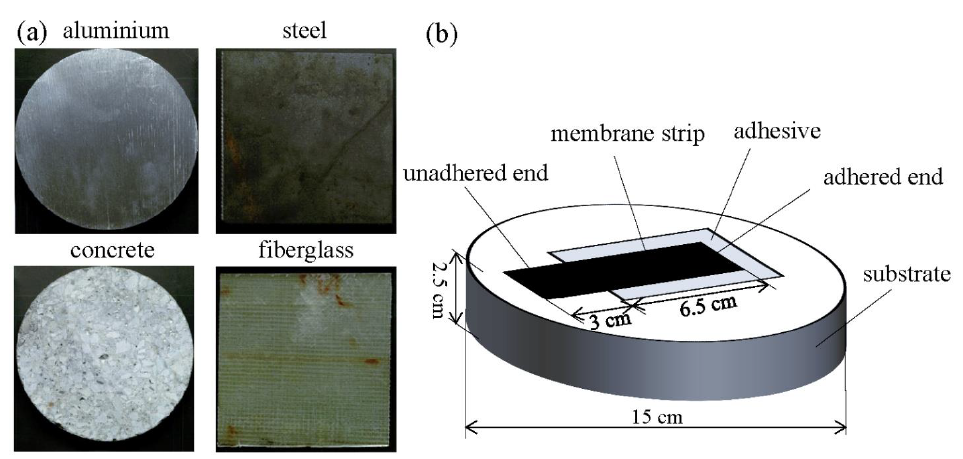
Figure 2 (a) Substrate surfaces; and (b) a schematic of one strip adhered on the substrate.
The substrates’ surfaces are shown in Figure 2(a). Six peel-testing strip samples (each 1.3 cm x 9.5 cm) were cut from each membrane (Figure 1(b)) and adhered onto each substrate. Substrate surfaces were ground using abrasive papers and cleaned with ethanol. The membrane samples were then deployed by hand onto the adhesives and any air bubbles were gently squeezed out. The mixing and curing procedures of adhesives were based on the commercial instructions given for each adhesive. Figure 2(b) is a schematic of the prepared specimen for a single strip.
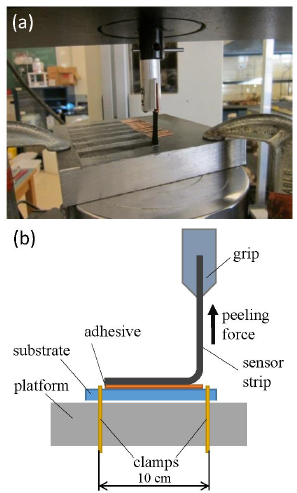
Figure 3(a) A peel resistance test on the Instron 5569 platform; and (b) a schematic of the peel resistance test.
Tests were conducted at constant rates of extension (peeling rates) at 25 mm/min and 250 mm/min. Figure 3 shows a picture (Figure 3 (a)) and a schematic (Figure 3(b)) of the test setup. A copper tape was used between the grips and the membrane to increase friction. Three strip samples were tested at each peeling rate for each adhesive and each substrate, for a total of 96 tests.
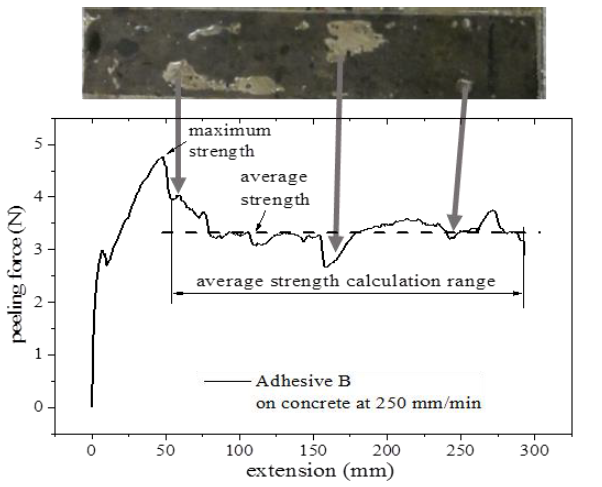
Figure 4 The peeling force as a function of peeling extension (bottom) and corresponding post-peel picture (top) for a typical result.
Figure 4 shows a typical result for a peeling test, here using adhesive B on concrete at 250 mm/min peeling rate. As marked on the plot, the maximum strength is taken as the maximum force over the total length of the extension, which typically occurs at the beginning of the test. The average strength is calculated after the first drop in the peeling force. Figure 4 (top) shows that post-peel regions include two parts: a residual SEBS-CB layer (black) and substrate surface regions (light gray).
RESULTS AND DISCUSSION
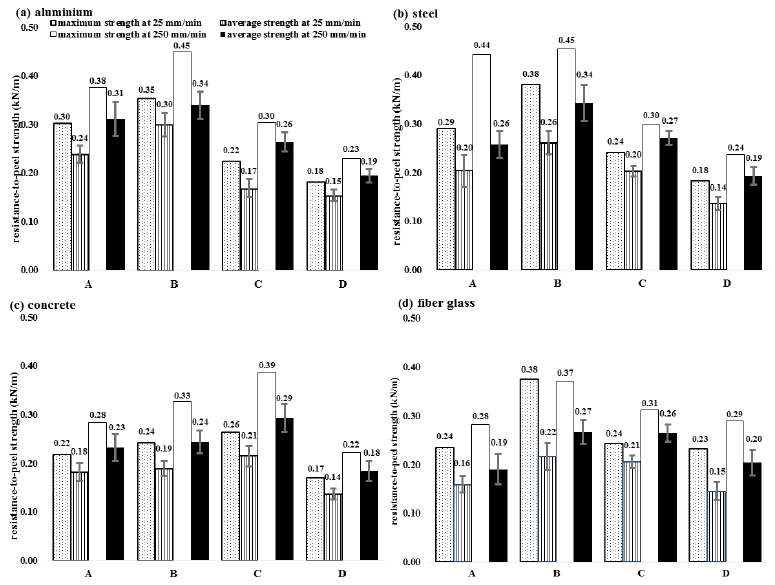
Figure 5 The peel resistance of four adhesives on (a) aluminium, (b) steel, (c) concrete, and (d) fiberglass.
Figure 5 shows the peel resistance of the adhesives on aluminium, steel, concrete, and fiberglass, respectively. Results reveal a positive relationship between the peel resistance and the peeling rate in all 16 data sets on both maximum and average strengths. Furthermore, as shown in Figures 5(a) and 5(b), adhesive B shows the highest average strength on aluminium and steel substrates at both peeling rates, indicating that adhesive B is more suitable for metal substrates compared to other adhesives. Figure 5(c) shows that adhesive C exhibits the best performance for concrete, and Figure 5(d) shows that both adhesive B and adhesive C have similar average strength for fiberglass.
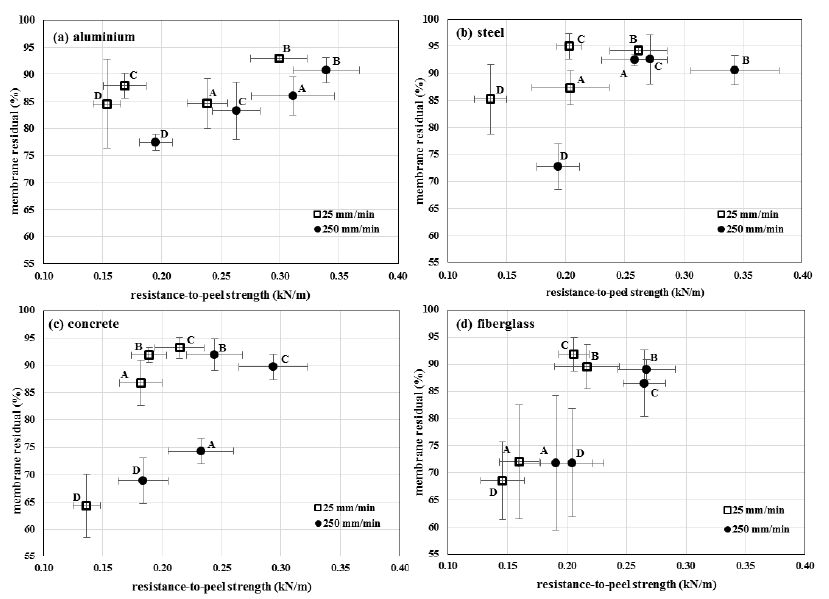
Figure 7 The residual percentage of membranes as a function of the peel resistance of four adhesives on (a) aluminium; (b) steel; (c) concrete; and (d) fiberglass; “A”, “B”, “C”, and “D” stand for adhesives A, B, C and D, respectively.
Figure 7 presents results of the residual percentage of membranes as a function of the resistance to- peel strength to provide an additional measure of adhesive performance. The residual membrane results from the cohesive substrate failure, i.e., failure of the adherend. Moreover, the peeled membrane is attributed to adhesion failure indicating inferior bonding performance in the area. All adhesives show a positive correlation between the membrane residual and the resistance-to-peel strength, except adhesive C.
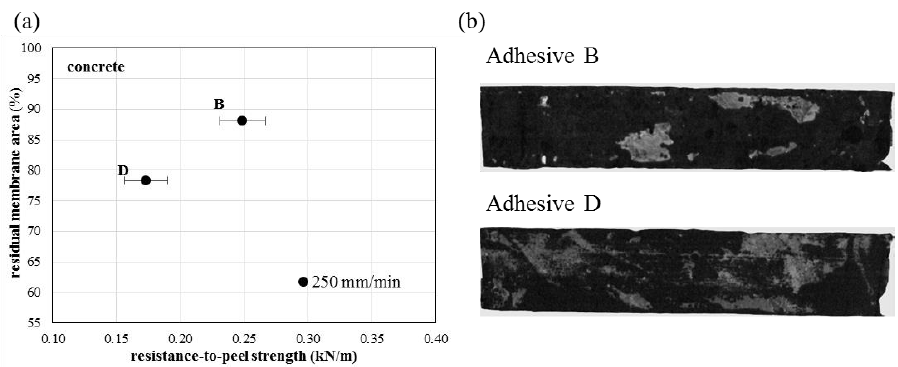
Figure 8(a) Residual percentage of two individual strip samples (adhesive B and adhesive D) on a concrete substrate as a function of the peel resistance with (b) corresponding post-peel areas at a peeling rate of 250 mm/min.
Figure 8 compares the membrane residuals for two extreme examples, namely, two samples using adhesives adhesive B and adhesive D, respectively, on a concrete substrate as a function of the peel resistance with corresponding post-peel areas at a peeling rate of 250 mm/min.
Figure 8(a) shows that the post-peel residual percentage of the adhesive B adhered membrane (88%) is significantly higher than that of the adhesive D adhered membrane (78%), consistent with a higher peel resistance (0.249 kN/m) than that of the adhesive D sample (0.173 kN/m). Figure 8(b) shows pictures of the post-peel surface of both samples. The peeled area of the sample using adhesive B exhibits a few concentrated regions without residuals.
CONCLUSION
The peel resistance of four adhesives on common structural materials was investigated to study their applicability in large-scale deployment of a sensing membrane for SHM of mesosystems. The membrane layer adhering to the adhesive is an SEBS-CB composite. The adhesives under study consisted of adhesive A, adhesive B, adhesive C, and adhesive D. The structural material substrates were aluminium, steel, concrete, and fiberglass. Adhesive B exhibited the highest peel resistance on aluminium, steel, and fiberglass substrates, and adhesive C showed the highest strength on concrete.
A cost analysis revealed that adhesive C was substantially more costeffective compared to the other adhesives. The relationship between the peel resistance and the post-peel membrane residual percentage was also investigated. Adhesive B shows the highest peel resistance corresponding to the highest residual percentage of membrane after peel tests. Adhesive C did not exhibit a positive correlation between the peel resistance and residual percentage relation. Lastly, membrane samples with adhesive D exhibited major regions of adhesive failure, resulting in an inferior bonding performance on all substrates studied.
Source: Iowa State University
Authors: Wei Zeng | Weixing Sun | Nicola Bowler | Simon Laflamme