ABSTRACT
The authors have recently developed two novel solutions for strain sensing using nanocomposite materials. While they both aim at providing cost-effective solutions at monitoring local information on large-scale structures, both technologies are different in their applications and physical principles. One sensor is made of a cementitious material, which could make it suitable for embedding within the core of concrete structures prior to casting, and is a resistor, consisting of a carbon nanotube-cement based transducer.
The other sensor can be used to create an external sensing skin and is a capacitor, consisting of a flexible conducting elastomer fabricated from a nanocomposite mix, and deployable in a network setup to cover large structural surfaces. In this paper, we advance the understanding of nanocomposite sensing technologies by investigating the potential of both novel sensors at dynamic monitoring of civil structures.
First, and in-depth dynamic characterization of the sensors using a uniaxial test machine is conducted. Second, their performance at dynamic monitoring of a full-scale concrete beam is assessed, and compared against the shelf accelerometers. Experimental results show that both novel technologies compare well against mature sensors at vibration-based structural health monitoring, showing the promise of nanocomposite technologies at monitoring large-scale structural systems.
BACKGROUND
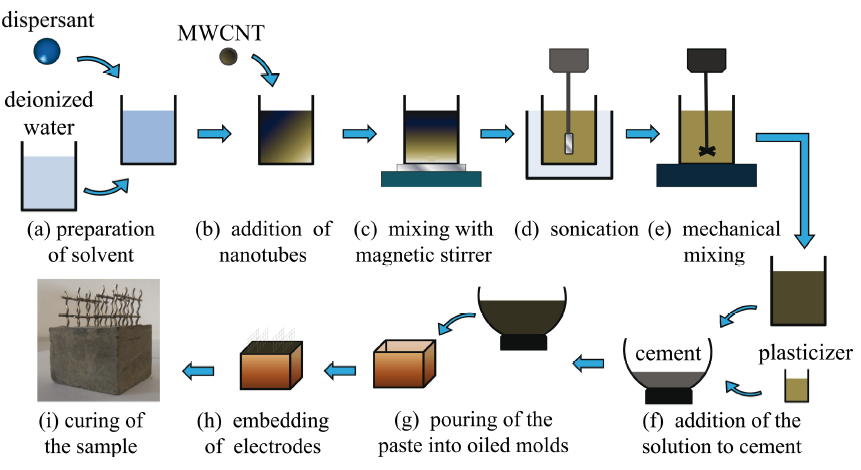
Figure 1: Fabrication process of a CNTCS.
The fabrication process of a CNTCS is shown in Fig. 1. First, an ammonium polyacrylate-based dispersing additive (BYK 154) is added to deionized water in the amount of 1% by weight of CNTs (Fig. 1(a)). Then, Multi-Wall Carbon Nanotubes (MWCNTs) (type Arkema Graphistrength C100) are added to the solvent in the proper amount (2% by weight content of cement) (Fig. 1(b)). Dispersion of nanoparticles is the crucial step that mostly affects the final result, as the suitable electrical properties of nanomodified cement matrix are achieved only if a homogeneous CNTs network is formed in the composite material.
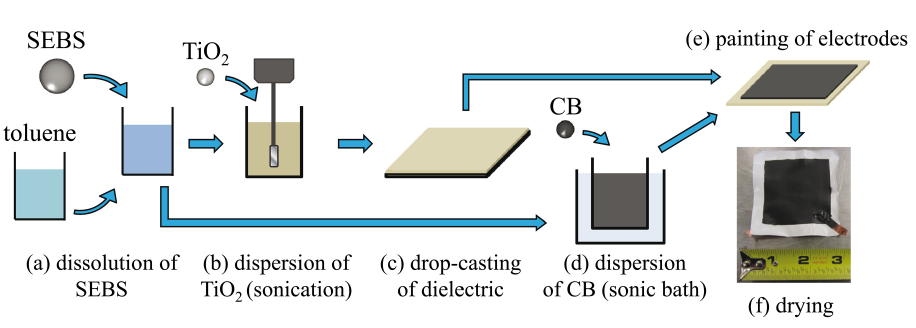
Figure 3: Fabrication process of an SEC.
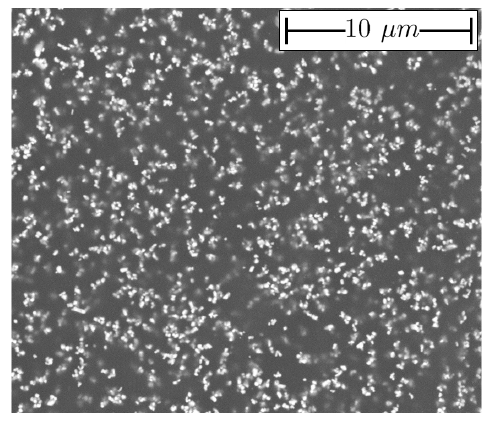
Figure 4: SEM picture of the SEC.
The fabrication process of an SEC is shown in Fig. 3. First, the SEBS (Mediprene Dryflex) matrix is dissolved in toluene (Fig. 3(a)). The solution is doped with TiO2 rutile (Sachtleben R 320 D) by dispersing a 15% vol. concentration using an ultrasonic tip (Fisher Scientific D100 Sonic Dismembrator) (Fig. 3(b)). The addition of these inorganic particles into the SEBS matrix increases the permittivity and durability of the polymer. The SEBS-TiO2 mix is drop casted on an 80 x 80 mm2 glass slides and dries for 48 hours to let the toluene evaporate (Fig. 3(c)).
During this drying phase, a 10% vol. concentration of CB (Printex XE 2-B) is added to another SEBS-toluene mix. The CB particles are dispersed in a sonic bath over 24 hours (Fig. 3(d)). The conductive mix is painted onto the top and bottom surfaces of the dried dielectric (SEBS+TiO2) to create the electrodes, and let drying for 48 hours to let the toluene evaporate. Two conductive copper tapes are embedded in the electrode mix to allow a mechanical connection to the sensor. Fig. 3(f) is a picture of the resulting SEC. Fig. 4 is a SEM picture of the resulting SEC showing a good dispersion of the TiO2 particles.
METHODOLOGY USED FOR THE COMPARISON
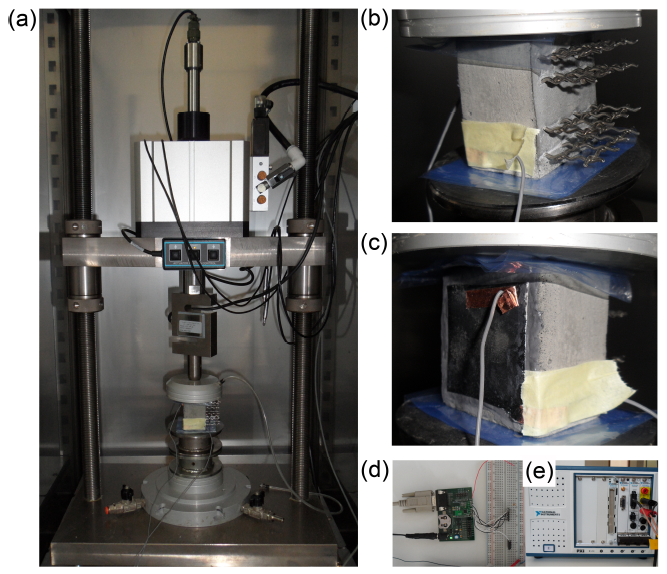
Figure 6: Test setup for the dynamic validation.
Figure 6: Test setup for the dynamic validation: (a) uniaxial test machine with CNTCS-SEC specimen; (b) detail view of tested CNTCS; (c) detail view of SEC adhered onto the surface of the CNTCS; (d) detail view of the DAQ system for SEC; and (e) detail view of DAQ system for CNTCS.
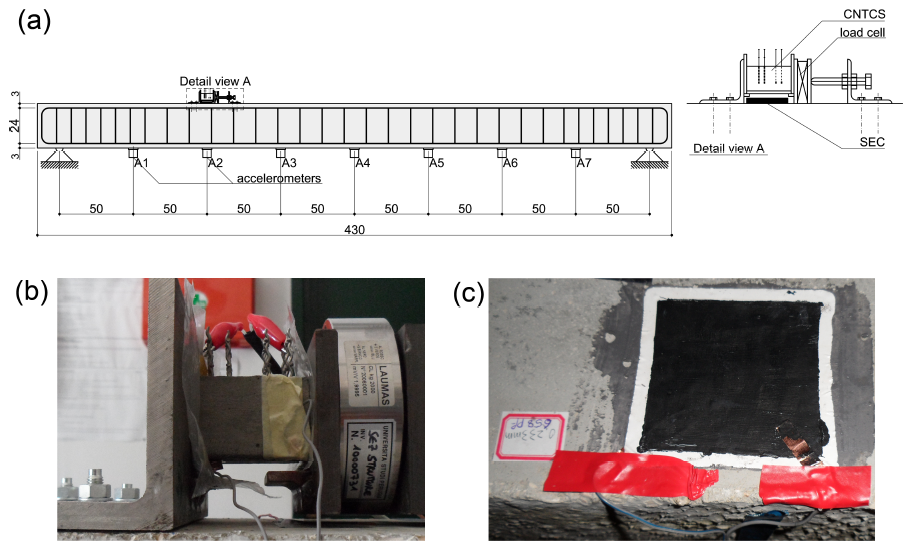
Figure 7: Test setup for the full-scale RC beam.
Fig. 7 shows the laboratory setup for the full-scale RC beam. (a) sensors’ layout with dimensions in cm; (b) detail view of CNTCS mounted on the beam; and (c) detail view of the SEC glued onto the surface of the beam.
EXPERIMENTAL RESULTS
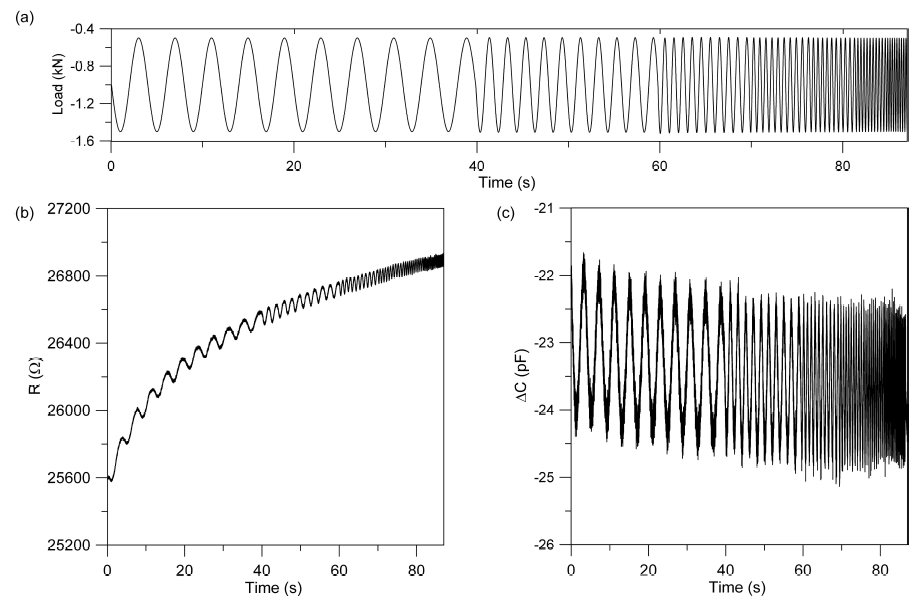
Figure 8: Sensors responses: (a) applied load; (b) CNTCS; and (c) SEC.
The experimental study is initiated with the dynamic characterization of both sensors. Both specimens are subjected to a harmonic load varying between 0.25 to 15 Hz with discrete increments. Fig. 8 shows the sensors responses over the range 0.25-4 Hz. Both sensors exhibit a drift in the time domain that can be due to electrical charges in the sensor.

Figure 11: Wavelet transform for the CNTCS signal: (a) 0.25-4 Hz; (b) 5-11 Hz; and (c) 12-15 Hz. The black dotted line is the frequency excitation.

Figure 12: Wavelet transform for the SEC signal: (a) 0.25-4 Hz; (b) 5-11 Hz; and (c) 12-15 Hz. The black dotted line is the frequency excitation.
Figs. 11 and 12 show the wavelet transforms for each of the sensors. The wavelet transform uses morlet wavelets on three sections of the original signal extracted using a Tukey windowing function to reduce frequency leakage. The wavelet coeffcients are normalized over each time bin. The black dotted line in Figs. 11 and 12 represents the frequency input, ramping from 0.25 to 15 Hz.
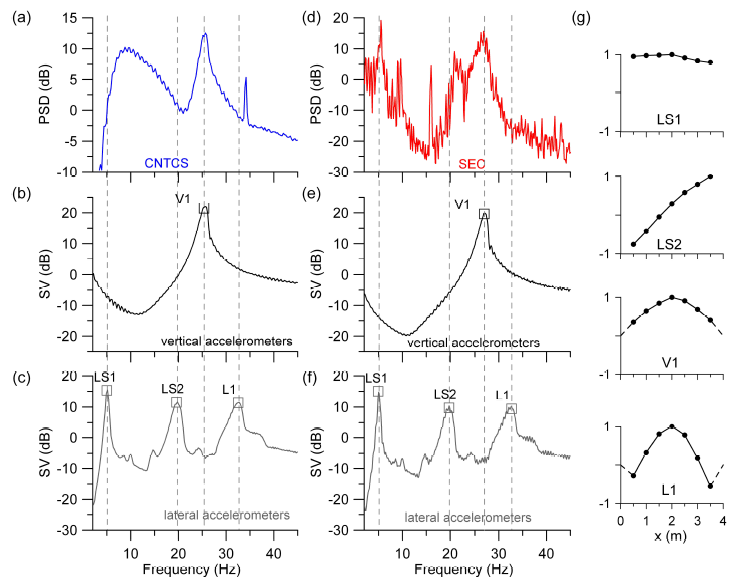
Figure 13: FDD results.
Figure 13: FDD results: (a) PSD of CNTCS’s output; (b) first SV line of vertical acceleration data acquired simultaneously to CNTCS’s output; (c) first SV line of lateral acceleration data acquired simultaneously to CNTCS’s output; (d) PSD of SEC’s output; (e) first SV line of vertical acceleration data acquired simultaneously to SEC’s output; (f) first SV line of lateral acceleration data acquired simultaneously to SEC’s output; and (g) mode shapes identified form acceleration data.
CONCLUSION
Two novel solutions for strain sensing using nanocomposite materials recently proposed by the authors have been further studied by investigating their potential at dynamic monitoring of civil structures. Both technologies are aimed at providing affordable solutions for monitoring local strain in large-scale structures, but are different in terms of applications and physical principles.
The CNTCS is embeddable in concrete structures because its is fabricate from a cement-based material and can transduce variations in axial strain in variations of electrical resistance. The SEC has been developed to be a surface sensor, and can be used in a matrix form to create an external sensing skin. It can transduce variations in axial strain in variations in electrical capacitance. The main conclusions of this study are as follow:
- Dynamic characterization of CNTCS and SEC using a uniaxial test machine has shown that both sensors are capable of closely tracking excitation frequencies in the range of 0:25 to 15 Hz.
- The normalized calibration curves of both sensors have been obtained in the uniaxial test. While the CNTCS behaves as a slightly nonlinear transducer, with a sensitivity that increases in compression, the SEC exhibits a linear signal-strain relationship that agrees well with its theoretical electro mechanical model.
- Frequency response curves of CNTCS and SEC have been obtained with dynamic compression tests. The curves show that the outputs of both sensors are rate dependent. In particular, the frequency response curves of CNTCS is monotonically increasing with the frequency while that of SEC is monotonically decreasing with the frequency. Both sensors seem to tend to an ideally linear dynamic behavior, with constant frequency response curves, at large frequencies.
- The pioneering application of the two novel sensing technologies in vibration monitoring of a RC beam has demonstrated their ability to clearly detect the frequency of the fundamental vibration mode at about 26 Hz, independently identied using data recorded from on-the-shelf accelerometers. Lower lateral modes have been identified by the SEC, while a higher lateral mode has been identied by the CNTCS.
Results presented in this paper show a promise toward the use of the nanocomposite technologies in vibration-based structural health monitoring systems, providing a solution to the meso-scale challenge in SHM of civil structures, such as tall buildings, bridges, road pavements and more.
Source: Iowa State University
Authors: Filippo Ubertini | Simon Laflamme | Halil Ceylan | Annibale L. Materazzi | Gianluca Cerni | Hussam Saleem | Antonella D’Alessandro | Alessandro Corradini