ABSTRACT
Cementitious materials doped with carbon nanoparticles are robust materials capable of transducing strain into changes in electrical resistance. These properties encourage the development of spatially distributed sensors for structural health monitoring of concrete structures. Yet, very few applications of transducers made of cement-based nanocomposites to structural elements have been documented. The majority of applications are limited to measurement of static responses.
The authors have recently proposed the novel application of cement-based nanocomposite technologies for vibration-based structural health monitoring of concrete structures. To this aim, prismatic sensors made of cement paste doped with carbon nanotubes have been proposed as embedded sensors for concrete structures. Prior results have shown the promise of these sensors at vibration measurements. In this paper, the authors further the understanding of the dynamic behavior of cement-based carbon nanotube sensors by conducting experiments on a full-scale reinforced concrete beam for output-only identification of natural frequencies.
The performance of the novel sensor is benchmarked against off-the-shelf strain gauges and accelerometers. Results show that the proposed sensor compares well against existing technologies at vibration monitoring. Also, the nanocomposite sensor is capable of detecting high frequencies, which is made possible by a very low level of noise and an excellent signal-to-noise ratio obtained from shielded wire connections and proper tailoring of the fabrication process.
DESCRIPTION OF NANOTUBE CEMENT-BASED SENSORS
The fabrication process of CNTCS is schematically described in Fig. 1. First, the plasticizer, type SKY 521, is added to deionized water in the amount of 5% of the volume of water (Fig. 1(a)). Second, MWCNTs are added to the mix (Fig. 1(b)). The MWCNTs solution is first mixed with a magnetic stirrer for 10 minutes (Fig. 1(c)). It is followed by 15 minutes of sonication with a 225 W ultrasound and a probe series Vibra Cell Bioblock Scientific model 75043. (Fig. 1(d)).
Lastly, the solution is mixed for 15 minutes with a mechanical agitator with a speed of rotation of 1500 rev/min (Fig. 1(e)). The nanomodified aqueous solution resulting from the mixing procedure is added to cement powder (Fig. 1(f)), and manually mixed to obtain the nanocomposite cement paste. The material is then poured into oiled molds (Fig. 1(g)) and the copper electrodes are embedded in the paste (Fig. 1(h)). 1 After settling, the sample is unmolded for curing (Fig. 1(i)).

Figure 2: SEM pictures of the CNTCS: (a) water suspension with CNTs; and (b) hardened composite cement paste.
SEM analyses are reported in Fig. 2 (a) for the water solution with MWCNT after the mixing procedure and in Fig. 2 (b) for a fragment of hardened nanocomposite cement paste. Both figures demonstrate the good dispersion of nanotubes and the effectiveness of the mixing process.
EXPERIMENTAL PROCEDURES
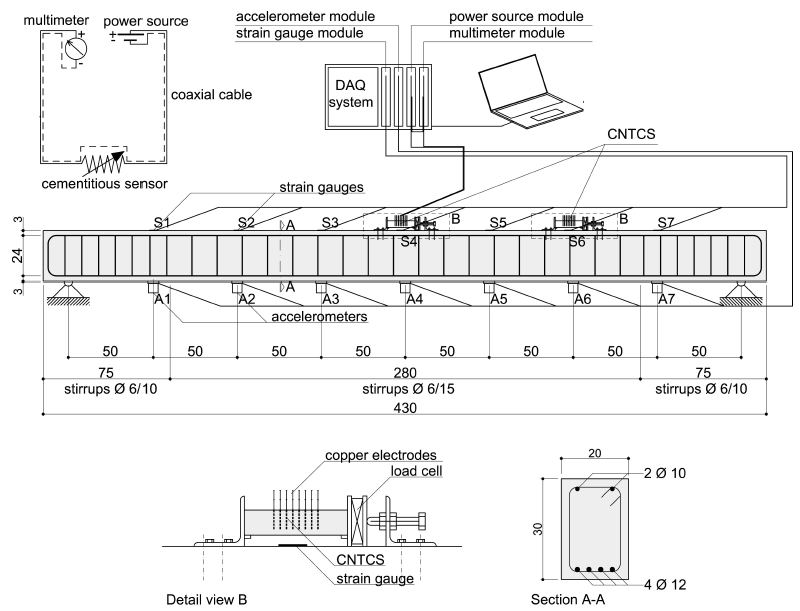
Figure 3: Layout of the experimental setup and plans of the investigated RC beam (dimensions in cm).
The laboratory setup comprises (see Fig. 3): (i) a simply supported RC beam; (ii) carbon-nanotube cement-based sensors, off-the-shelf accelerometers, an impulse hammer, and electric strain gauges; (iii) a chassis for data acquisition with five slots; (iv) a power source module for providing stabilized electrical input to the CNTCS; (v) a digital multimeter module for measuring the electrical response of the CNTCS; (vi) a data acquisition module and A/D converter for strain gauges; and (vii) a data acquisition module and A/D converter for accelerometers and impulse hammer.
RESULTS AND COMPARISONS
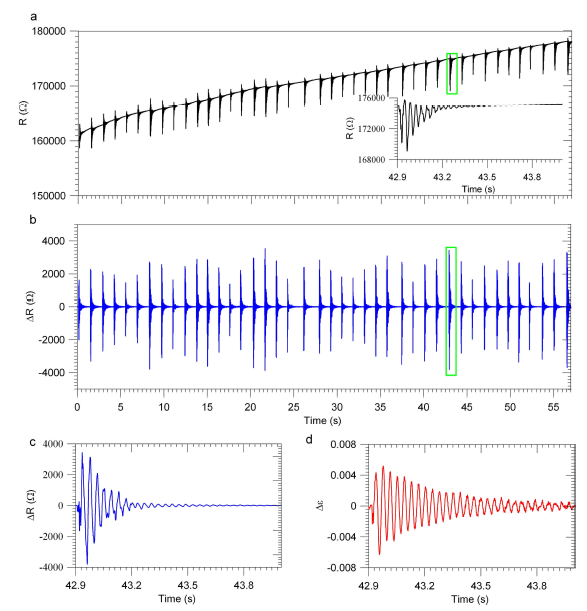
Figure 5: Vibration monitoring of the RC beam using CNTCS placed at mid-span: sensor output before high-pass filtering.
Figure 5: Vibration monitoring of the RC beam using CNTCS placed at mid-span: sensor output before high-pass filtering (a); sensor output after high-pass filtering (b); blow up on sensor output (c); detailed window plot of the output of the strain gauge place at the location of the CNTCS (d).
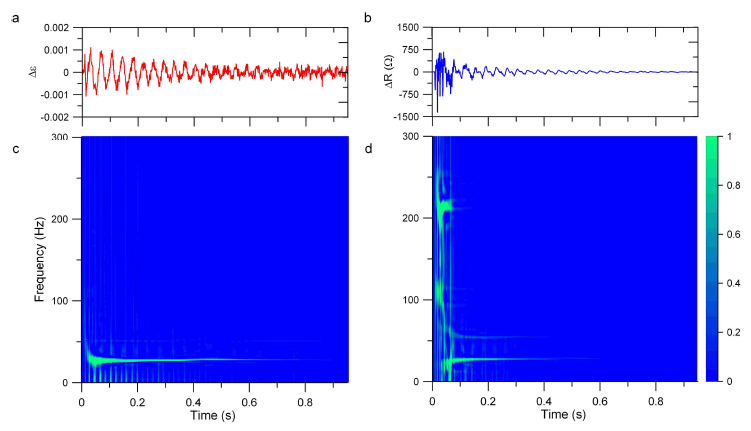
Figure 7: Time-frequency analysis of strain measurement and corresponding CNTCS output at quarter-span: strain gauge (a); and CNTCS (b).
Fig. 7 shows time-frequency plots in the range 0 to 300 Hz using the Choi- Williams distribution (Eq. (5)) for the CNTCS and strain gauge outputs placed at quarter-span. The signal from the strain gauge shows a single frequency around 27 Hz. The time-frequency plot of the strain gauge does not exhibit higher frequencies, because of a more significant level of noise in the measurements. The signal outputted by the CNTCS shows the same 9 fundamental frequency around 27 Hz, with a much shorter decay time.
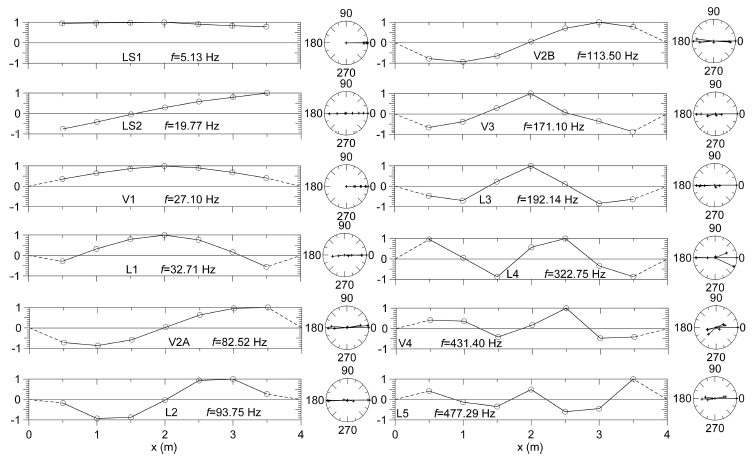
Figure 9: Mode shapes identified using signals recorded by accelerometers and associated polar plots. Vertical and lateral modal components are shown in vertical and lateral modes, respectively.
Identified modes are five vertical modes, denoted V1, V2A, V2B, V3 and V4, five lateral modes, denoted L1 to L5, and two additional lateral modes, denoted LS1 and LS2. The meaning of modes V2A and V2B will be clarified below. Identified mode shapes are reported in Fig. 9.
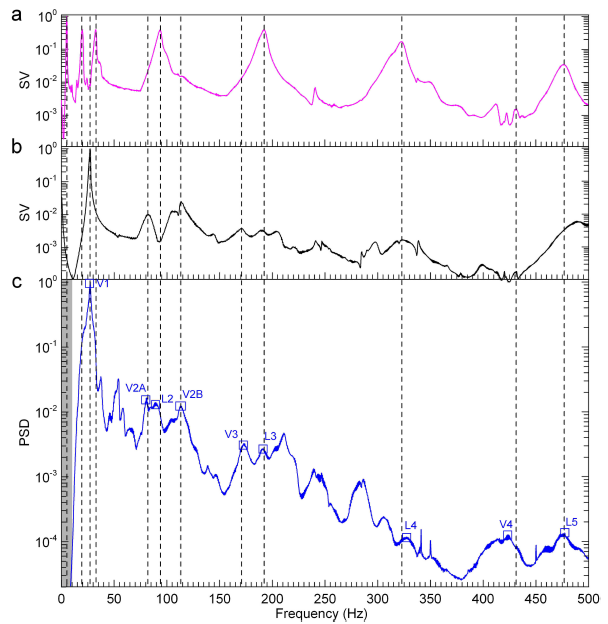
Figure 10: Identification of natural frequencies with CNTCS.
Figure 10: Identification of natural frequencies with CNTCS: first normalized singular value of lateral acceleration data (a); first normalized singular value line of vertical acceleration data (b); peaks of the normalized PSD of the output of CNTCS (c) (the gray area denotes filtered region).
CONCLUSIONS
In this paper, the use of composite cementitious sensors with carbon nanotubes has been proposed for vibration monitoring of RC structures. Prismatic transducers made of multifunctional strain-sensing cement paste doped with carbon nanotubes have been prepared with an optimized fabrication process to ameliorate the dispersion of MWCNTs.
Vibration experiments covered a frequency range to an extent never investigated in previous work. Results from the experiments were bench marked against mature, off the-shelf accelerometers and strain gauges. Overall results have shown that the novel nanocomposite cement-based sensors are promising for output-only identification of natural frequencies. Specific conclusions of this work are as follows.
- The CNTCS outputs very small levels of current intensities, and thus requires the use of high precision multimeters for measurements. The tailored fabrication process of CNTCS resulted in an enhanced sensitiv ity associated to a high unstrained electrical resistance. Also, improved shielding of the electrical circuit connecting the sensor, data acquisition and power modules using a coaxial cable has almost eliminated elec tromagnetic noise, and enabled modal identification over a frequency range up to 500 Hz.
- CNTCS exhibit a non-linear input-output behavior, with a hysteresis larger during compression than during decompression.
- Electrical polarization of CNTCS results in signal distortions at low449 frequencies that can be eliminated using high-pass filtering (in this paper, above 10 Hz). This may limit applications of the sensing solution to signals with energy concentrated at relatively high frequencies. Here, it was possible to identify a fundamental frequency located around 27 Hz.
- Results of the experimental tests have demonstrated that the output of the cementitious sensors contains the spectral components of all vertical vibration modes identified by off-the-shelf sensors. Non significant differences were observed between results from the CNTCS and accelerometers.
- The non-linear behavior of the nanocomposite sensors results in harmonic distortion effects that produced a spurious super harmonic frequency equal to the double of the fundamental. This effect could be filtered out via post signal processing.
Source: Iowa State University
Authors: Filippo Ubertini | Annibale L. Materazzi | Antonella D’Alessandro | Simon Laflamme
