ABSTRACT
This work focuses on the analysis of a new nano composite cement-based sensor (carbon nanotube cement based sensor), for applications in vibration-based structural health monitoring of civil engineering structures. The sensor is constituted of a cement paste doped with multi-walled carbon nanotubes, so that mechanical deformations produce a measurable change of the electrical resistance. Prior work of some of the authors has addressed the fabrication process, dynamic behaviour and implementation to full-scale structural components.
Here, we investigate the effectiveness of a linear lumped-circuit electromechanical model, in which dynamic sensing is associated with a strain-dependent modulation of the internal resistance. Salient circuit parameters are identified from a series of experiments where the distance between the electrodes is parametrically varied. Experimental results indicate that the lumped-circuit model is capable of accurately predicting the step response to a voltage input and its steady-state response to a harmonic uniaxial deformation. Importantly, the model is successful in anticipating the presence of a superharmonic component in sensor’s output.
CARBON NANOTUBE CEMENT-BASED SENSORS
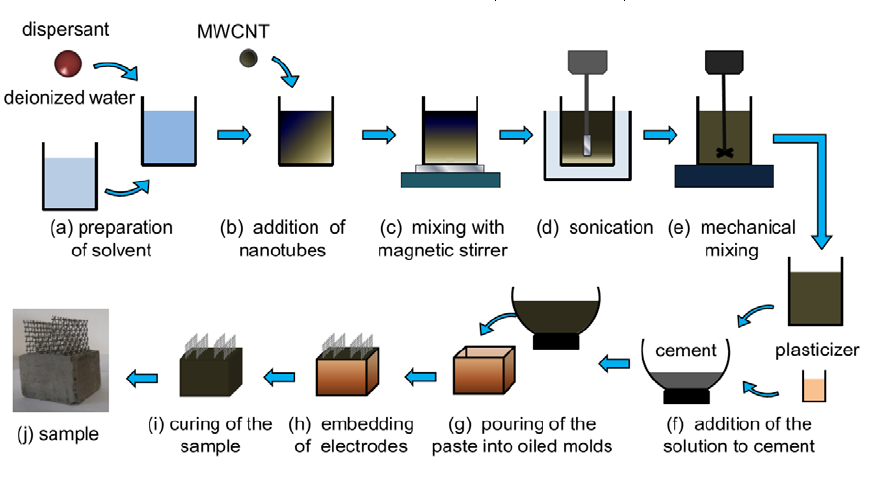
Figure 1. Preparation scheme of CNTCS with embedded steel net electrodes.
In the first phase, MWCNTs are spread in deionized water mixed with addiction of ByK154 chemical dispersant. ByK154 is an acrylate copolymer ammonium salt solution (Fig. 1(a), (b)). Mixing is obtained through 10 minutes of magnetic stirrer (Fig. 1(c)), 15 minutes of sonication (Fig. 1(d)), and 15 minutes of mechanical mixing (Fig. 1(e)).
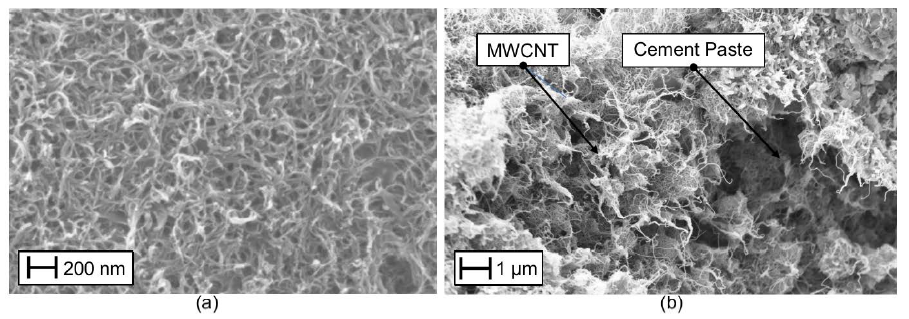
Figure 2. Scanning electron micrographs of water solution with MWCNT (a) cement paste with MWCNT (b).
The quality of the dispersion of MWCNTs in the matrix is ascertained through micrographs from a Scanning Electron Microscope (SEM). A few representative micrographs are shown in Fig. 2, demonstrating good dispersion of MWCNTs in the aqueous solution, Fig. 2(a), and in the cement paste, Fig. 2 (b). The embedded electrodes consist of stainless steel nets that are directly inserted in the specimens along approximately 75% of their thickness.
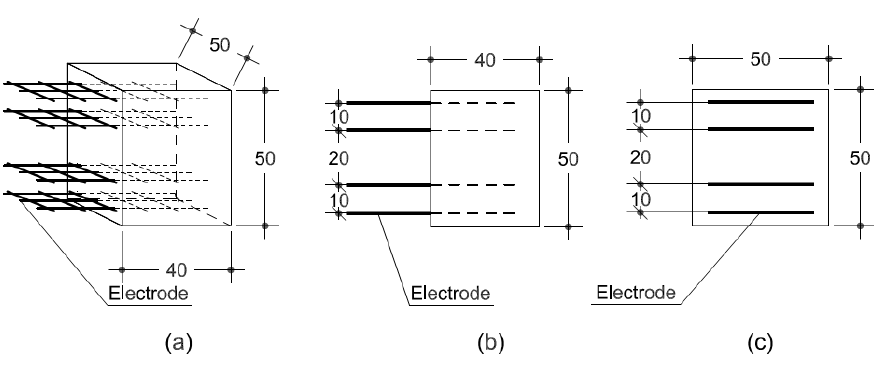
Figure 3. Sketch and dimensions (in mm) of the Carbon Nanotube Cement-based Sensor: axonometric view (a), side view (b), and front view (c).
In each specimen, four electrodes are placed symmetrically along the central axis. Specifically, the two inner electrodes are placed at a distance of 2 cm, the external electrodes have a relative distance of 4 cm, and the distance between an internal and an external electrode is 1 cm, as shown in Fig. 3.
ELECTROMECHANICAL MODEL
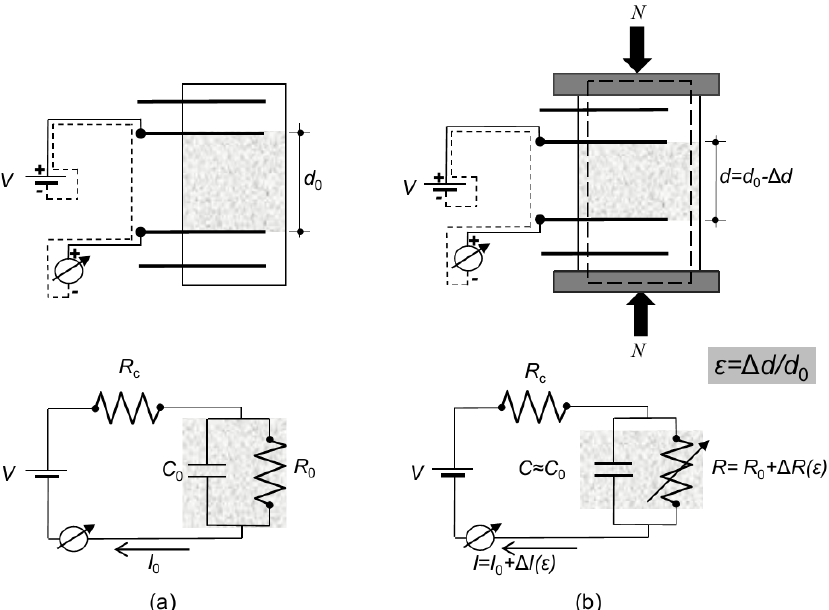
Figure 4. Schematic of the proposed electromechanical model of a CNTCS: unloaded (a) and loaded samples (b).
In a second series of experiments, a compressive axial load, N, induces a mechanical deformation of the sensor and, consequently, a small variation of the distance between the active electrodes, Δd, shown in Fig. 4. This variation is, in turn, expected to modulate the time evolution of the electrical properties of the CNTCS with respect to the nominal values.
EXPERIMENTAL METHODS
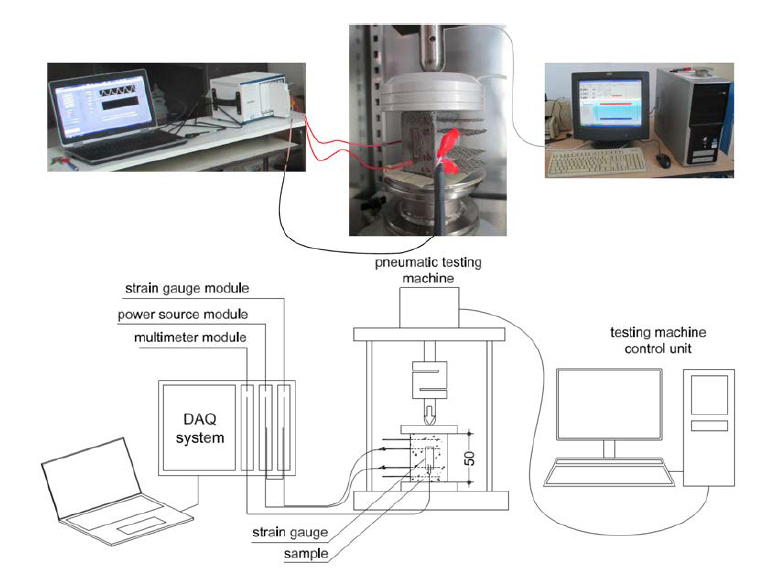
Figure 5. Experimental setup. From left to right, data acquisition system, sample placed in the axial pneumatic testing machine, and testing machine control unit.
A series of experiments are conducted to verify the equivalent circuit model adopted for CNTCSs. The electrical behaviour of the CNTCS is studied in a first study, and the strain sensing capabilities is investigated in a second study. The experimental setup is illustrated in Fig. 5. National Instruments NI PXIe-1073 chassis is used to acquire data. A source measure unit, model NI PXI-4130, generates the stabilized potential difference V that is applied to the electrodes of the specimens through coaxial cables. The electrical current through the sample is measured using a high speed digital multimeter, model NI PXI-4071.
EXPERIMENTAL RESULTS
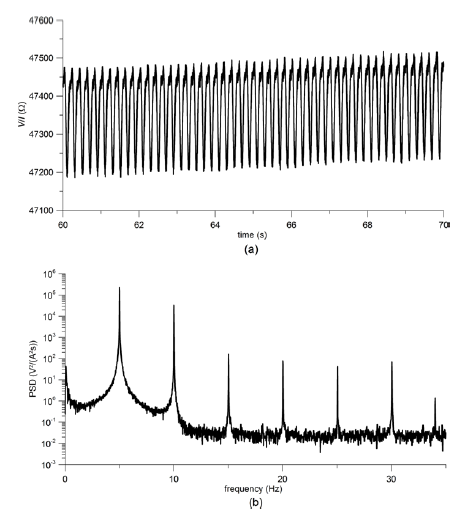
Figure 7. Variation of apparent resistance (a) and its PSD (b) under 5 Hz sinusoidal axial loading (1±0.5 kN) for a distance between the electrodes of 3 cm.
Figure 7 reports the time trace of the apparent electrical resistance, that is, the ratio between the input voltage and the output current (a) along with its power spectral density (PSD) (b) obtained under the 5Hz harmonic loading. In agreement with Eq. (8), results reported therein demonstrate that the dynamic response of the sensor is not monochromatic, but rather contains superharmonics at 10 Hz, 15 Hz, and other multiples of 5Hz.
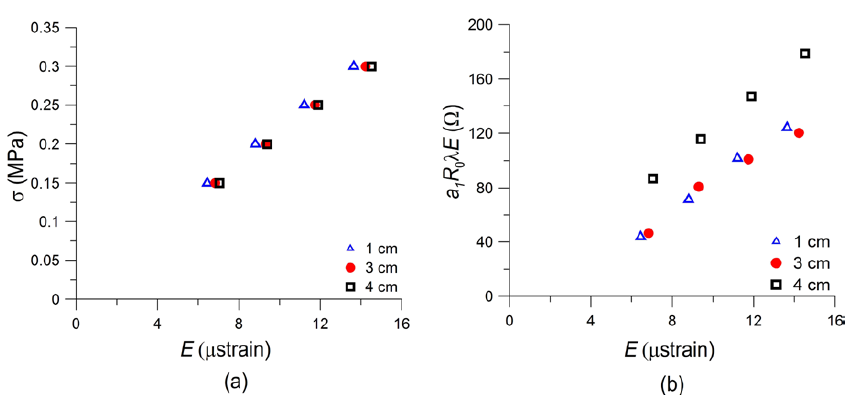
FIGURE 8. Stress-strain behaviour of the sensor (a) and amplitude of first harmonic in Eq. (8) versus the strain amplitude (b).
Notably, results of Figure 8 (a) indicate a tangent Young’s modulus for the nanocomposite cement paste of approximately 20 GPa. This value is considerably larger than the Young’s modulus of plain cement pastes, and this is likely due to the stiffening effect of the nano reinforcement and dynamic nature of the test. Results presented in Figure 8 (b) offer further evidence that the presence of super harmonics should not be related to non linearities, as we find that the relationship between the amplitude of the first harmonic, Eq. (8), and the amplitude of the axial strain, E, is also approximately linear, independently of the distance between electrodes.
CONCLUSIONS
In this paper, we have assessed a lumped-circuit model to interpret the response of a new nanocomposite cement-based sensor, consisting of a cement paste doped with carbon nanotubes. The lumped-circuit model consists of two resistors and a capacitor, which account for contact resistance, electric polarization, and internal dissipation. Strain sensing is enabled by the change of the electrical properties of the composite as a function of the applied load.
Specifically, we propose a linear relationship between the variation of the relative change of the internal electrical resistance and axial strain. The model has been experimentally validated by measuring the step response of unloaded specimens and the steady state response due to harmonic axial compressive loads. Model predictions are in good agreement with experimental findings, offering a solid basis for future work on such sensors, including the development of signal processing tools, an improved understanding of the dependence of the electrical properties on geometrical and physical factors, and the formulation of design guidelines.
Source: Iowa State University
Authors: Antonella D’Alessandro | Filippo Ubertini | Annibale L. Materazzi | Simon Laflamme | Maurizio Porfiri