ABSTRACT
Fatigue cracks on steel components may have strong consequences on the structure’s serviceability and strength. Their detection and localization is a difficult task. Existing technologies enabling structural health monitoring have a complex link signal to-damage or have economic barriers impeding large-scale deployment. A solution is to develop sensing methods that are inexpensive, scalable, with signals that can directly relate to damage.
The authors have recently proposed a smart sensing skin for structural health monitoring applications to mesosystems. The sensor is a thin film soft elastomeric capacitor (SEC) that transduces strain into a measurable change in capacitance. Arranged in a network configuration, the SEC would have the capacity to detect and localize damage by detecting local deformation over a global surface, analogous to biological skin.
In this paper, the performance of the SEC at detecting and localizing fatigue cracks in steel structures is investigated. Fatigue cracks are induced in steel specimens equipped with SECs, and data measured continuously. Test results show that the fatigue crack can be detected at an early stage. The smallest detectable crack length and width are 27.2 mm and 0.254 mm, respectively, and the average detectable crack length and width are 29.8 mm and 0.432 mm, respectively. Results also show that, when used in a network configuration, only the sensor located over the formed fatigue crack detect the damage, thus validating the capacity of the SEC at damage localization.
SMART SENSING SKIN

Figure 1: Fabrication process of the SEC.
These CB particles are selected to improve conductivity at low cost, and prolong the life time of the polymer due to their antioxidant and ultraviolet light stabilization properties. The utilization of the same polymer matrix (SEBS) for both the electrodes and dielectric results in a strong mechanical bond between the layers that constitute the SEC. The SEC is fabricated using a solution cast process, shown in Fig. 1.
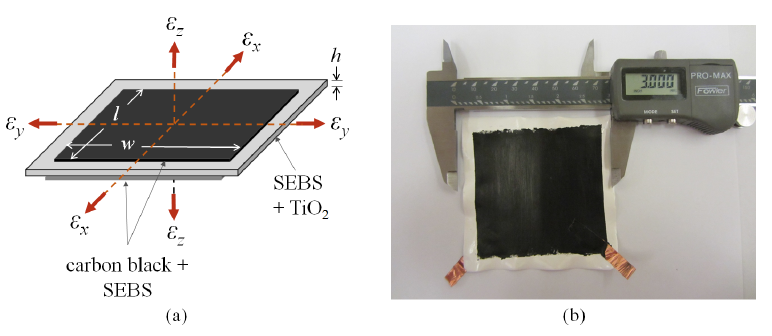
Figure 2: (a) Schematic of SEC with principle axes; and (b) a picture of a single SEC (76.2 x76.2 mm2 (3 x 3 in2)).
Figure 2(a) shows a schematic representation of the sensor, and Fig. 2(b) is a picture of a single SEC measuring 76.2 x 76.2 mm2 (3 x 3 in2). Note that its geometry (e.g., shape and size) can be customized. The resulting sensor combines the advantages of being low cost, highly flexible, mechanically robust, easy to install, and low-powered.

Figure 3: Quasi-static strain test: (a) strain time histories; (b) measurement error; and (c) linearity of the SEC signal.
Fig. 3 shows the results from the quasi-static load test. The signal of the SEC is converted into strain using Equation (4). A comparison of the measured strain time history versus the strain input at the sensor location is shown in Fig. 3(a). Results show that the SEC is capable of tracking a quasi-static strain history within a given level of resolution. The measurement error is plotted in Fig. 3(b), which confirms an approximate resolution of 25 με“. Lastly, the linearity of the sensor over the measured strain range is illustrated in Fig. 3(c), where the measured capacitance is plotted against the strain input.
METHODOLOGY
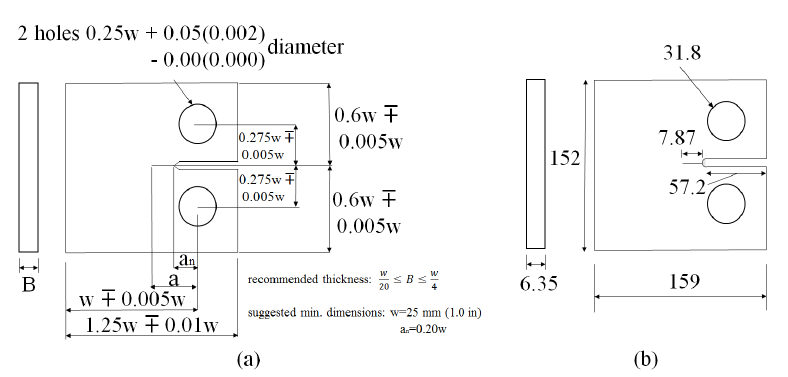
Figure 4: (a) Details of a standard compact specimen for testing of fatigue crack growth (adapted from ASTM E647-13a); and (b) dimensions (mm) of the test specimens.
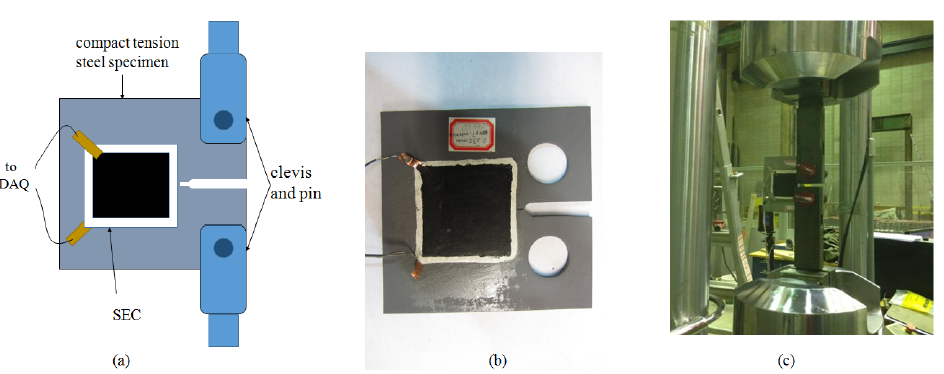
Figure 5: (a) Schematic of the laboratory setup (damage detection test); (b) picture of the prepared test specimen with an SEC; and (c) picture of the laboratory setup.
The specimens used in this study are single edge-notch compact tension (CT) made of A36 steel with an ultimate tensile strengths of 500 MPa (72.5 ksi). The specimens were fabricated with a width of 152 mm (6 in), a thickness of 6.35 mm (0.25 in), and punched holes diameters of 31.8 mm (1.25 in). For the damage detection tests, a sensor of dimensions 76.2 x 76.2 mm2 (3 x 3 in2) was adhered in the middle of the specimen surface (Fig. 5(a)).
Smaller SECs of dimensions 38.1 x 38.1 mm2 (1.5 x 1.5 in2) were used in the damage localization tests to accommodate all sensors (Fig. 10(a)). To help the growth of the fatigue crack, the specimens were cut 0.31 in at the notch using the recommended minimum value in ASTM E647-13a. Figure 4(a) shows the details of the compact specimen from ASTM E647-13a, and Fig. 4(b) shows the dimensions used in the experiment.
EXPERIMENTAL RESULTS

Figure 7: Time history versus capacitance for (a) test 1; (b) test 2; and (c) test 3. The vertical dashed line denotes the time at which the fatigue crack was visually observable.
A series of tests was conducted on specimens equipped with a single SEC to study the capacity of the sensor to detect damage. Figure 7 shows the time series measurements of the SECs for all three tests. A low-pass filter was used to smoothen data. The vertical dashed line in each plot indicates the time at which the fatigue crack was visually observable). Time series data from Fig. 7 show that the formation of the fatigue crack is visually observable in the capacitance signal, featured by a step increase in the time series data before the signal plateaus because of the test termination.
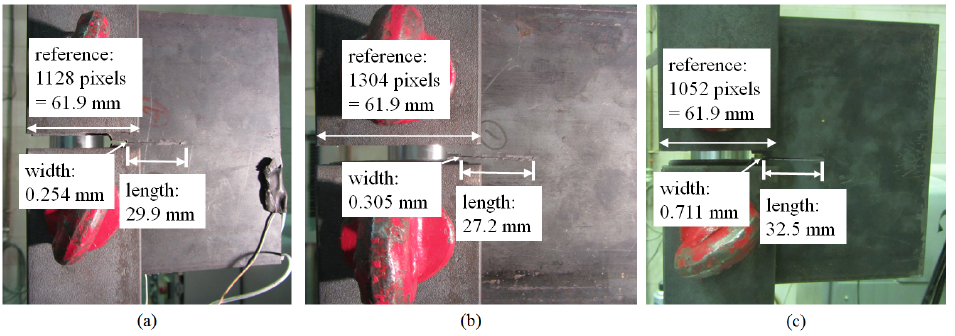
Figure 8: Pictures of cracked specimens at the plateau: (a) test 1; (b) test 2; and (c) test 3.
Figure 8 shows the picture of the specimens taken after pausing of the MTS. Reports the dimensions of cracks and width of clevis in both pixels and inches. The results show that the smallest detectable crack length and width are 27.2 mm (1.069 in) and 0.254 mm (0.010 in), respectively, and the average detectable crack length and width are 29.8 mm (1.175 in) and 0.432 mm (0.017 in), respectively. Nevertheless, the SEC signals already exhibit a signicant change in the signal at the time of visual observation of crack initiation. This indicates that the smart sensing skin may possibly detect smaller crack sizes.
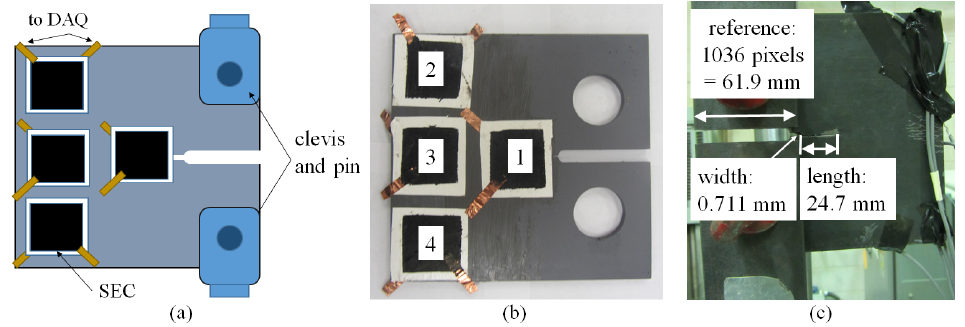
Figure 10: (a) Schematic of the laboratory setup (damage localization test); (b) sensor placement; and (c) picture of test results.
A second series of tests was conducted to evaluate the capacity of the SEC at localizing a fatigue cracks. Fig. 10(a) is a schematic of the laboratory setup. Four sensors were used in a network configuration. Fig. 10(b) shows the numbering scheme used in the experiment. Using results from the damage detection tests, a crack length of approximately 25.4 mm (1 in) was expected, therefore running under SEC 1 only.
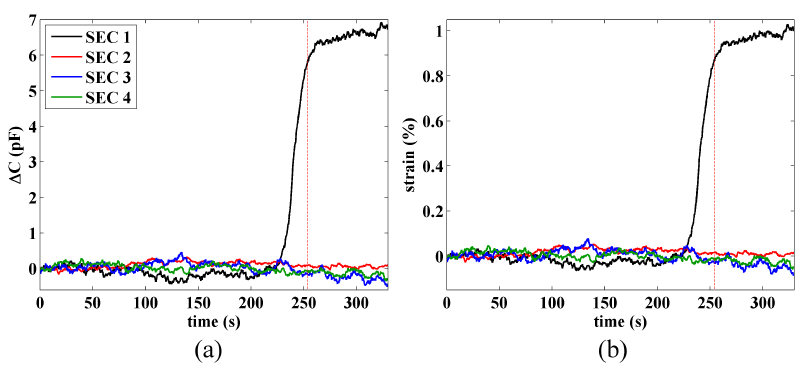
Figure 11: Time histories for damage detection test: (a) change in capacitance; and (b) measured strain. The vertical dashed line denotes the time at which the fatigue crack was visually observable.
The picture of a typical test result is shown in Fig. 10(c), with a fatigue crack of length and width of 24.7 mm (0.974 in) and 0.711 mm (0.028 in), respectively. Fig. 11 is a plot of the time series of all SECs showing the change in capacitance (Fig. 11(a)) and the corresponding strain using Equation (4) (Fig. 11(b)).
CONCLUSION
In this paper, the capability of a novel sensor, termed SEC, at detecting and localizing fatigue cracks was investigated. The SEC is a flexible large area electronics capable of covering very large areas at low cost. It is analogous to sensing skin, in the sense that it has the potential to monitor local deformations over a global area. Such feature makes it an ideal sensing solution for detecting and localizing local damages, such as fatigue cracks.
The background on the SEC was presented, which included the sensing materials, the electromechanical model, and a validation of the sensing principle. After, the testing methodology was discussed. Two test types have been conducted. The first one consisted of validating the damage detection capability by deploying a single sensor on a steel specimen subjected to a fatigue load.
Time series measurements from a sensor was correlated with visual observations and specimen pictures. A significant change in the measured signal occurred when the fatigue crack formed, which showed that damage was successfully detected. The smallest detectable crack length and width are 27.2 mm (1.069 in) and 0.254 mm (0.010 in), respectively, and the average detectable crack length and width are 29.8 mm (1.175 in) and 0.432 mm (0.017 in), respectively.
After this validation, a second series of tests was conducted to determine whether a network of SECs could be used also to localize damage. A similar methodology was used, but this time using four SECs. Time series results showed that only the SEC located over the formed fatigue crack detected the damage via a significant changed in its capacitance measurements. This validated that a network of SECs could be used to localize a fatigue crack.
Source: Iowa State University
Authors: Sari Kharroub | Simon Laflamme | Chunhui Song | Daji Qiao | Brent M. Phares | Jian Li