ABSTRACT
Pedestrian countdown signals (PCSs) are viable traffic control devices that assist pedestrians in crossing intersections safely. Despite the fact that PCSs are meant for pedestrians, they also have an impact on drivers’ behavior at intersections. This study focuses on the evaluation of the safety effectiveness of PCSs to drivers in the cities of Jacksonville and Gainesville, Florida.
The study employs two Bayesian approaches, before-and-after empirical Bayes (EB) and full Bayes (FB) with a comparison group, to quantify the safety impacts of PCSs to drivers. Specifically, crash modification factors (CMFs), which are estimated using the aforementioned two methods, were used to evaluate the safety effects of PCSs to drivers. Apart from establishing CMFs, crash modification functions (CMFunctions) were also developed to observe the relationship between CMFs and traffic volume.
The CMFs were established for distinctive categories of crashes based on crash type (rear-end and angle collisions) and severity level (total, fatal and injury (FI), and property damage only (PDO) collisions). The CMFs findings, using the EB approach indicated that installing PCSs result in a significant improvement of driver’s safety, at a 95% confidence interval (CI), by a 8.8% reduction in total crashes, a 8.0% reduction in rear-end crashes, and a 7.1% reduction in PDO crashes.
In addition, FI crashes and angle crashes were observed to be reduced by 4.8%, whereas a 4.6% reduction in angle crashes was observed. In the case of the FB approach, PCSs were observed to be effective and significant, at a 95% Bayesian credible interval (BCI), for a total (Mean = 0.894, 95% BCI (0.828, 0.911)), PDO (Mean = 0.908, 95% BCI (0.838, 0.953)), and rear-end (Mean = 0.920, 95% BCI (0.842, 0.942)) crashes. The results of two crash categories such as FI (Mean = 0.957, 95% BCI (0.886, 1. 020)) and angle (Mean = 0.969, 95% BCI (0.931, 1.022)) crashes are less than one but are not significant at the 95 % BCI.
Also, discussed in this study are the CMFunctions, showing the relationship between the developed CMFs and total entering traffic volume, obtained by combining the total traffic on the major and the minor approaches. In addition, the CMFunctions developed using the FB indicated the relationship between the estimated CMFs with the post-treatment year.
The CMFunctions developed in this study clearly show that the treatment effectiveness varies considerably with post-treatment time and traffic volume. Moreover, using the FB methodology, the results suggest the treatment effectiveness increased over time in the posttreatment years for the crash categories with two important indicators of effectiveness, i.e., total and PDO, and rear-end crashes. Nevertheless, the treatment effectiveness on rear-end crashes is observed to decline with post-treatment time, although the base value is still less than one for all the three years. In summary, the results suggest the usefulness of PCSs for drivers.
APPRAISAL OF SAFETY EFFECTS OF PEDESTRIAN COUNTDOWN SIGNALS TO DRIVERS USING CRASH MODIFICATION FACTORS
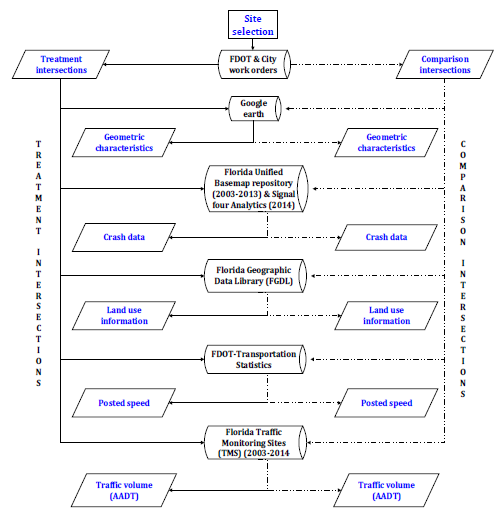
The historical imagery tool in Google Earth Pro software was utilized in ensuring the quality of the developed SPFs by checking the treatment sites to verify that there is no major geometric change during the study period. The flow chart in Figure 2.1 illustrates the strategy employed in collecting data for this study. The solid and dotted lines indicate the process for collecting data for treatment and comparison intersections, respectively.
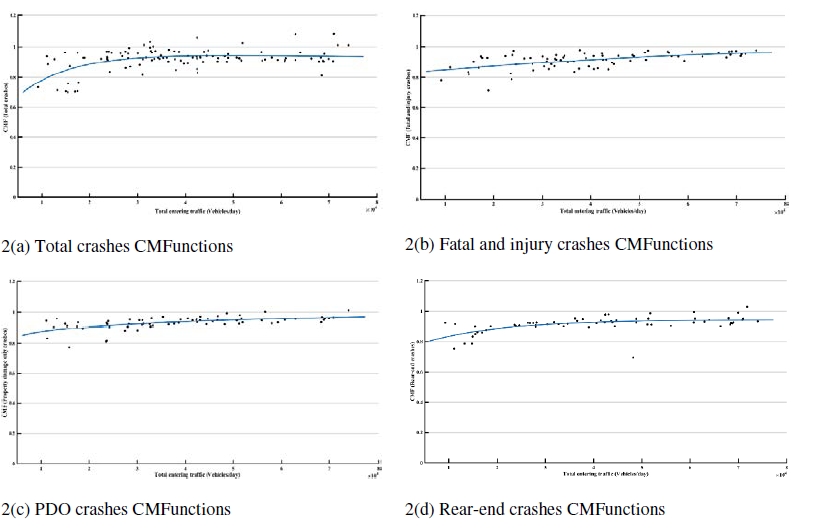
Non-linear regression models, i.e. inverse, power, quadratic, and exponential models, have been observed to be the best-fitted functions for different roadway characteristics (Park et al., 2015). As shown in Figure 2.2, linear and the abovementioned non- inverse, quadratic, power and exponential functions were compared, and the best-fitted functions for each crash category were selected based on the R-squared value. It is worth noting that, power and exponential functions were the best-fitted functions for this case. Treated sites were grouped based on the frequency distribution of crashes for each crash category in a manner to avoid observations with zero crash counts.
A FULL BAYESIAN APPROACH TO APPRAISE THE SAFETY EFFECTS OF PEDESTRIAN COUNTDOWN SIGNALS TO DRIVERS
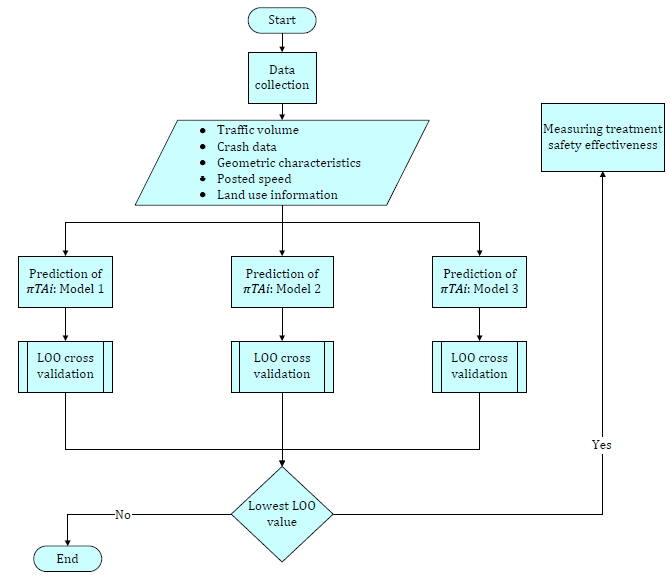
Figure 3.1 demonstrates, in summary, the procedure used to select the model with the highest prediction accuracy (LOO CV). In this study, the approximate LOO cross-validation approach was employed using the Pareto-smoothed importance sampling (PSIS) method, a new procedure for regularizing important weights. PSIS is an advanced method, which provides improved accurate and reliable CV estimate by fitting a Pareto distribution to the upper tail of the distribution of the important weights (Vehtari et al., 2016).
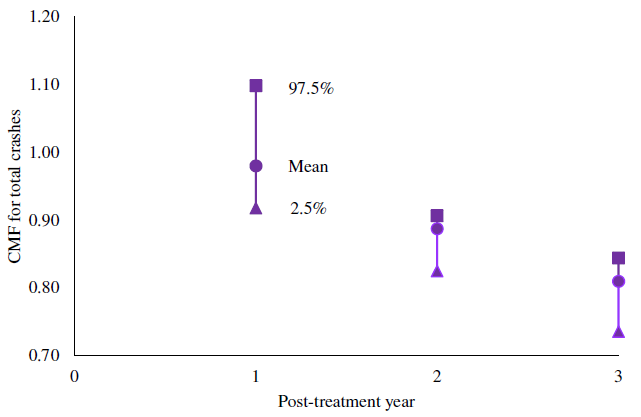
Figure 3.2. Yearly CMF for total crashes.
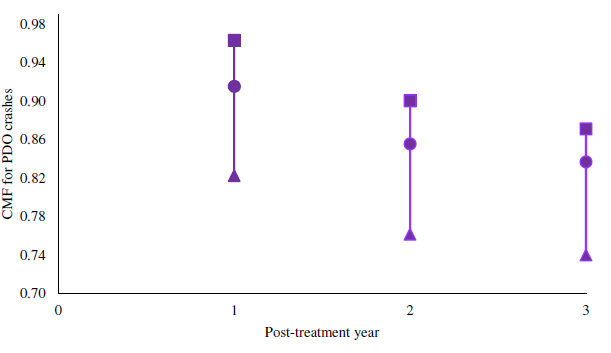
Figure 3.3. Yearly CMF for PDO crashes
Figures 3.2 and 3.3 shows a similar declining trend of the treatment effectiveness index for total and PDO crashes. From this trend, it may be concluded that the safety improvements of PCS to drivers improves in time after they are being installed at the respective intersections. However, the treatment effectiveness on rear-end crashes is observed to decline with post-treatment time, although the mean value is still less than one for all the three years.
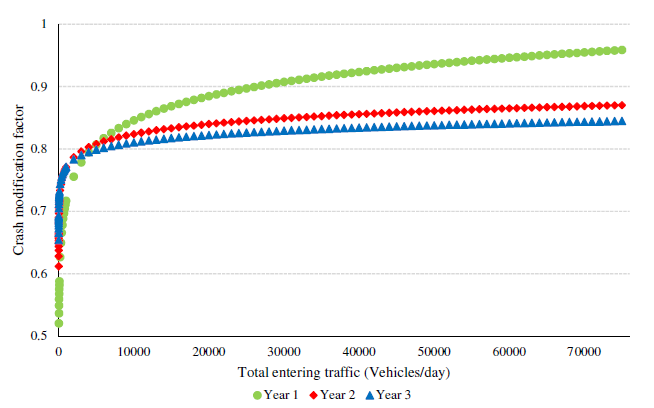
Figure 3.6. PDO CMFunction.
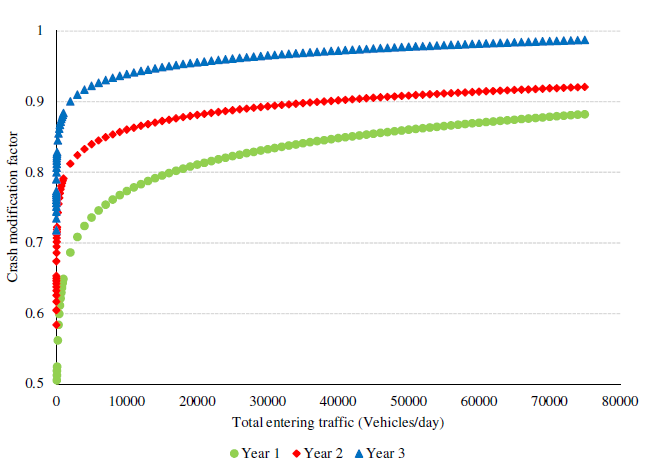
Figure 3.7. Rear-end CMFunction.
From these plots, it can be observed that the index of effectiveness (CMF) values generally increases with the traffic volume and then reaches an asymptotic value which is often close to one. This indicates less crash reduction for intersections with high traffic volume. In addition, the CMF values based on post-treatment time decreased generally over time in total crashes and PDO crashes (Figure 3.6), indicating a consequent improvement of safety over time, but have increased for rear-end crashes (Figure 3.7).
CONCLUSIONS AND RECOMMENDATIONS
This thesis evaluates the safety effects of PCSs to drivers at signalized intersections using two methods-empirical Bayes (EB) followed by full Bayes (FB). The study employs the before-and-after study approach with the comparison group. For each site, six-year crash data (from years 2003 through 2014) are used–three years for the before- and the other three for the after-period.
The analysis includes a total of 110 treatment and 93 comparison intersections. Comparison intersections are included to account for the external attributes that may influence the change in crash frequency apart from the main intervention, which is PCSs for this study. The study sites are located in the FDOT District 2, two cities in particular–Jacksonville and Gainesville.
The safety performance functions (SPFs) for the first method, i.e., EB approach were developed using the negative binomial model. In the case of the FB method, the Poisson log normal model with a piece wise linear change point for the before-and-after period was used. Several parameters including the site-level effect, jump, and paired-random effect parameters were introduced in the FB approach to improve model reliability. It is worth noting that the two count models used this study take into account the dispersion nature of crash occurrence.
Source: University of North Florida
Authors: Angela E. Kitali
