ABSTRACT
The Commonwealth of Kentucky has seen increasing use over time of preventative maintenance treatments on its asphalt pavements. Performance of two of the most prevalent treatments employed by the Kentucky Transportation Cabinet (KYTC)–Thin Asphalt Overlay (Thinlay) and Microsurfacing had yet to be examined in-depth through condition surveys. This thesis describes the data collection process to find the Pavement Condition Index (PCI) of each preventative maintenance site in Kentucky from the last 10 years.
With PCI from each site, deterioration curves were generated for each treatment – providing the estimated life extension benefit of each. The analysis then converted life extension to life cycle costs to ultimately determine which product was more cost effective. Cost effectiveness would be the definitive metric in determining which product should be used by KYTC. It is hoped that this thesis can begin to quantitatively and statistically answer the question of how to best approach asphalt maintenance projects in Kentucky.
PRODUCT DESCRIPTIONS
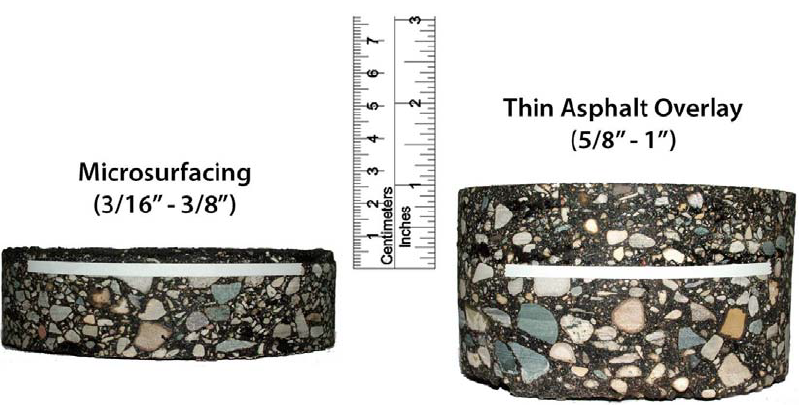
Figure 2.1: Microsurfacing/Thinlay Profiles (Plantmix Asphalt Industry of Kentucky).
Although both products are used in preventative maintenance applications, they have very different properties and construction practices. These properties range from the gradation of the mix to the simple thickness of the mat. Figure 2.1 below illustrates some of these differences.
ESTABLISHING AN EVALUATION METHOD
A number of different rating systems and evaluation methods exist for quantifying pavement conditions. Two prevalent methods were examined and compared. These are the PASER and PAVER systems, which utilize two very different procedures for collecting data and assigning a condition number to the pavement in question.
PASER is a more simplified method of surveying pavement condition. It involves examining pavement distresses from a general viewpoint as opposed to physically measuring cracks and deformations. There are rating categories for this system that range from 1 (failed pavement) to 10 (excellent pavement). The rating selected by the evaluator depends upon variables such as crack spacing, crack width, patching, crack spalling, and the density of fatigue cracking. The PASER manual provides pictures and descriptions of all the distress types and varying severity levels (Transportation Information Center 2002).
ASTM D6433 PROCEDURE
Once the desired number of sample units is gathered, the field work for that pavement section is complete, and the PCI calculation is performed. First, the density for each distress type is calculated as a percentage by dividing the measurement by the sample unit area. Using the density and the severity level, a deduct value is determined for that distress by consulting the deduct value curves provided by ASTM. The following graph is an example of the deduct value curves for alligator cracking. An example of a data sheet is also provided.
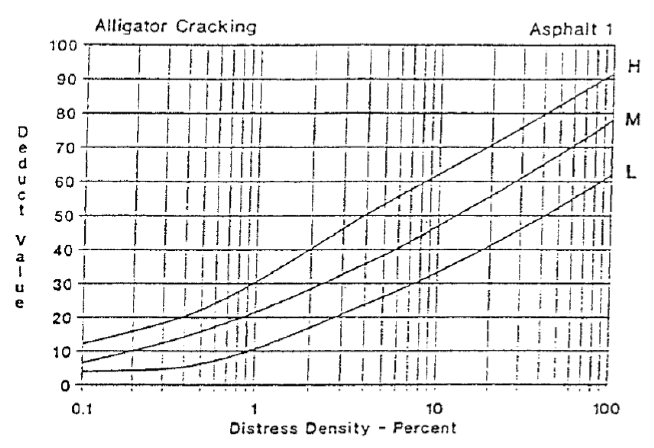
Figure 4.1: Alligator Cracking Deduct Curves (ASTM 2007).
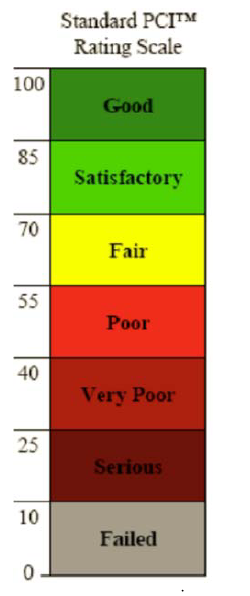
Figure 4.5: ASTM D6433 Rating Scale (ASTM 2007).
Once a PCI is calculated for each sample unit in the section, an area weighted average is calculated in order to determine the final PCI of the pavement. Figure 4.5 provides a rating scale based on the PCI value.
SOFTWARE DEVELOPMENT FOR PCI CALCULATION
The first step was to determine the equations for the deduct value curves, as well as the corrected deduct value curves. As described in the ASTM D6433 document, the process of developing the curves was empirically based without any strict mathematical equations defining them. Therefore, the curves were manually replotted by estimating the coordinate values along them. The CADRE Regression software was used to input the data points and apply a line of best fit to each curve. An equation for the line would then be displayed within the software. Some sample screenshots from CADRE are shown below.
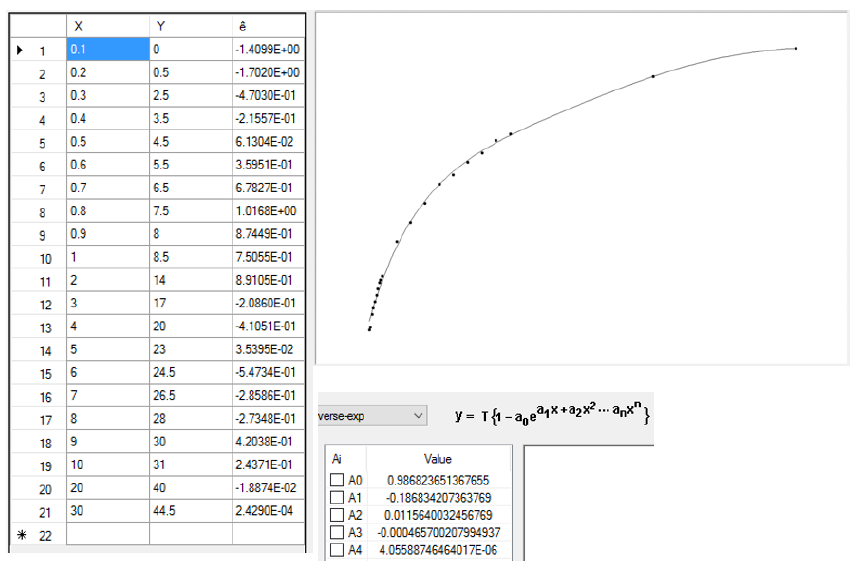
Figure 5.1: CADRE Regression Output.
Microsurfacing was found to be more susceptible to liquid asphalt bleeding than Thinlay. The bleeding would primarily originate from the presence of crack sealing material underneath the surface. While this distress did not contribute much numerically to the PCI difference, its commonality with Microsurfacing is worth noting. Some examples of this distress are shown below.
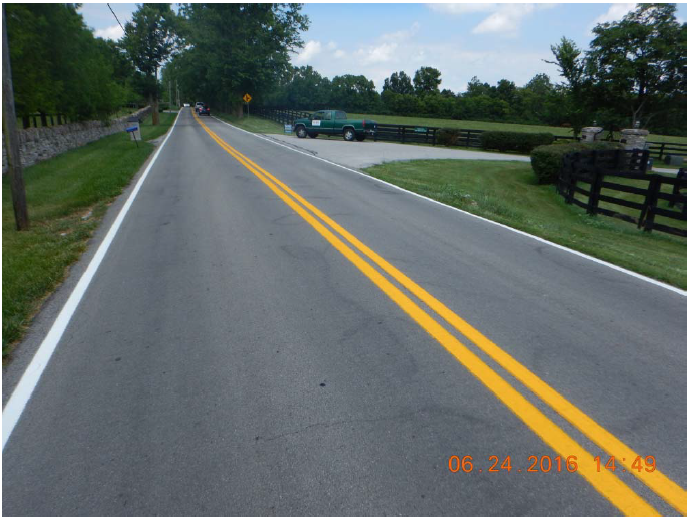
Figure 7.1: Fayette County, Bleeding Distress.
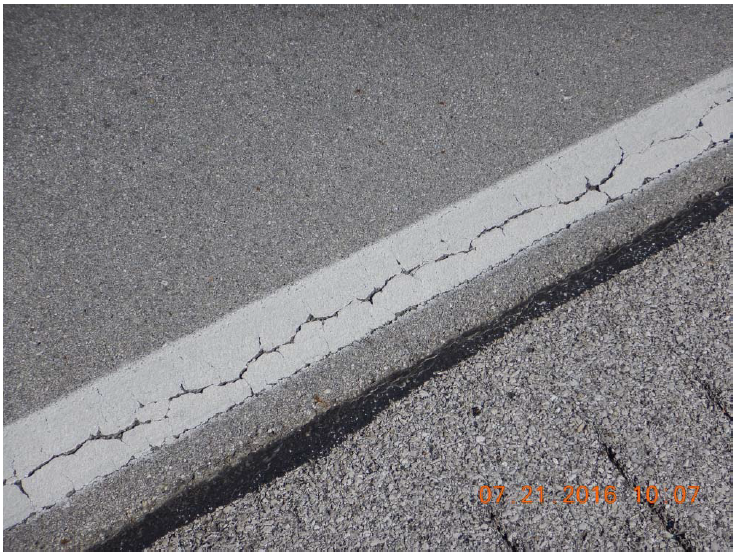
Figure 7.5: Pulaski County, Edge Cracking, Thinlay.
Alligator Cracking was a common distress encountered during the pavement evaluations. This distress is caused by repeated traffic loading that eventually causes the pavement to crack and break apart in a pattern similar to chicken wire or alligator skin. It is a symptom that there is structural damage occurring in the pavement, and that the cracks are forming from the bottom to the top. Alligator Cracking appeared to be more common amongst Microsurfacing sites than Thinlay.
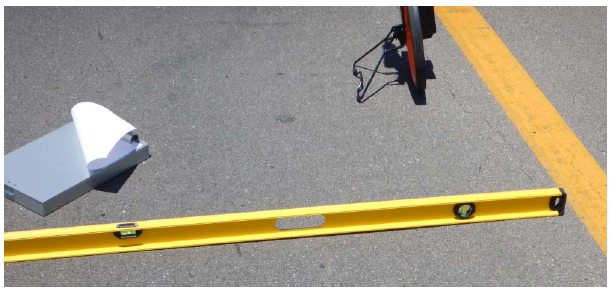
Figure 7.11: Nelson County, Rutting, Microsurfacing.
The distress within the ASTM method that most significantly contributed to PCI loss was rutting, which is longitudinal deformation caused by wheel loading. It was found that Microsurfacing recorded significantly more cases of rutting than Thinlay. All rutting recorded was found to be low severity, which means that the maximum depth was between ¼” and ½”. It could be that Microsurfacing is too thin to properly correct for even minor rutting, or that physical wearing in the wheel path is creating the rut. Some examples are shown below.
STATISTICAL ANALYSIS OF RAW DATA
To complete the analysis and check the validity of this model, the residual assumptions for linear regression should be checked. These assumptions are as follows:
- The residual errors have a mean value of zero
- The residual errors are independent
- The residual errors have a constant variance
- The residual errors have a normal distribution
The residual error plots used to verify these assumptions are shown below in Figure 8.1.
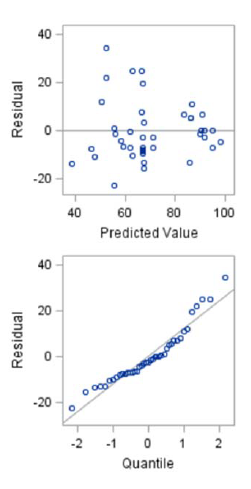
Figure 8.1: Residual and Quantile Plots.
GRAPHICAL REPRESENTATION OF PCI DATA
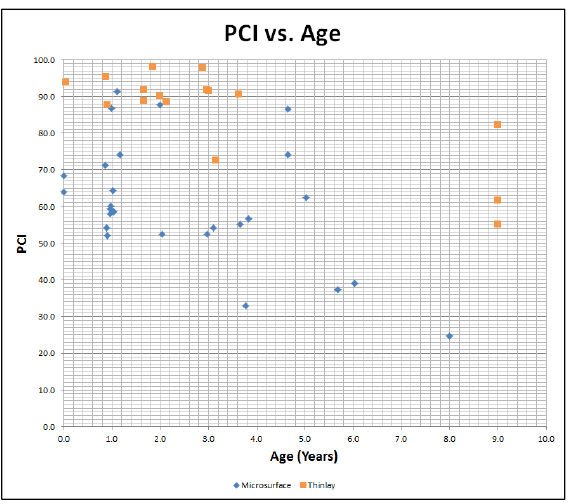
Figure 9.1: PCI vs. Age without Trendlines.
After compiling the raw PCI data from each site, it was decided that graphing PCI vs. surface Age would most likely be the most effective method to graphically represent the data. The statistical model found in Chapter 8 confirms this suspicion. Figure 9.1 below simply shows each data point, before applying a trendline.
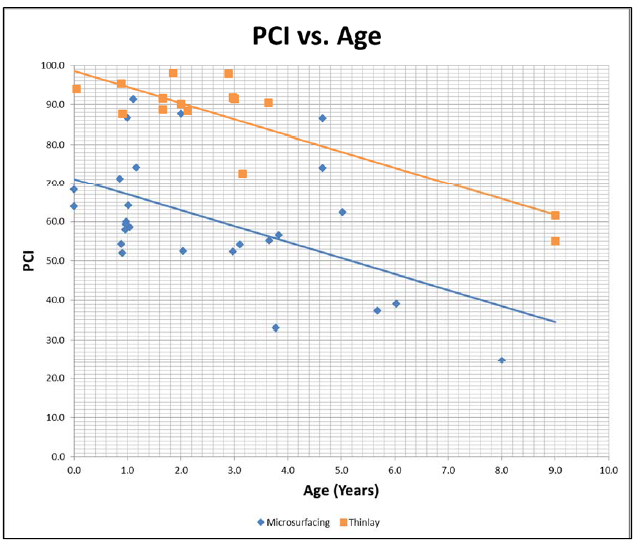
Figure 9.2: PCI vs. Age with Prediction Model.
Again, the treatments are both deteriorating at the same rate. However, Microsurfacing is possibly starting its life cycle at a much lower PCI. This is most likely due to Microsurfacing’s susceptibility to reflecting previous distresses. These plots are subsequently used to quantify the life extending benefit of each product. A common discussion in the pavement industry is how to define the threshold of when preventative maintenance should be used or not.
COST OF OWNERSHIP COMPARISON
Though Thinlay has been shown to provide more life extension than Microsurfacing, the question arises of which one provides more cost benefit? The first step is to determine the unit price of each product. This was accomplished by compiling prices and quantities from the bid tab for each project. Microsurfacing was simpler due to the fact that it is bid as dollars per square yard.
SUMMARY AND CONCLUSIONS
With the ever increasing use of Preventative Maintenance in Kentucky, it is significantly important to further study this issue to understand the value to the taxpayers of Kentucky. ASTM D6433 was selected as the method of evaluation due to its unbiased and statistical approach. After a period of approximately two months, PCI data for all the projects was obtained and compiled into a spreadsheet database.
From the first glances at the completed data, it became apparent that Thinlay was outperforming the Microsurfacing sites from an engineering point of view. The data was graphed and trendlines were applied based off of the multiple linear regression model in Chapter 8. After deciding to use PCI vs. Age as the primary graphing method, Figure 11.1 was used as the basis for the age/cost analysis:
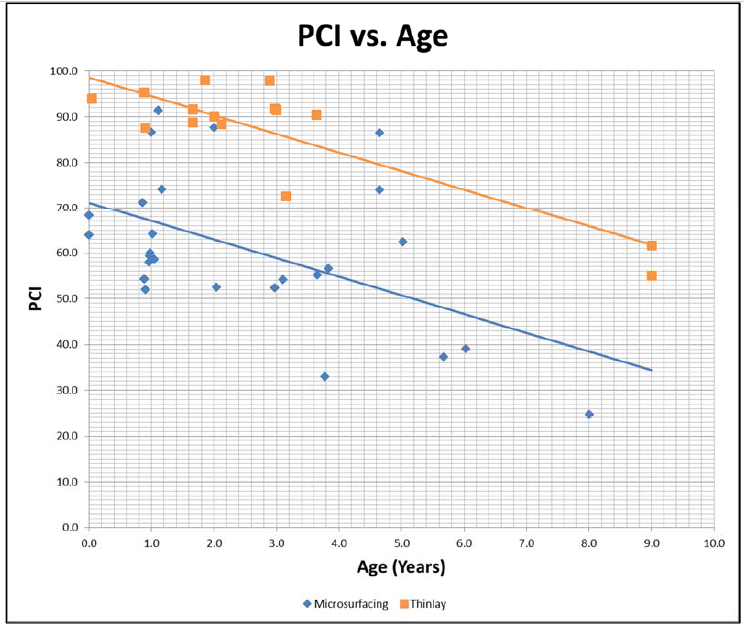
Figure 11.1: PCI vs. Age with Prediction Model.
The statistical results from Chapter 8 showed that there is a significant difference in PCI performance between Microsurfacing and Thinlay. However, the difference is not in the slope of PCI vs. Age but in the PCI towards the start of each product’s life. It can be suspected that Microsurfacing begins at a lower PCI depending on the condition of the pavement it is applied to. This concept was demonstrated when comparing the percondition distresses at Warren and Allen County to the distresses after Microsurfacing was applied.
The rutting encountered in those sites immediately reflected through the treatment–indicating that Microsurfacing does not provide the structure necessary to fill ruts. The alligator cracking encountered at Allen County did not reflect through immediately. However, it should be noted that preventive maintenance should not be used to correct structural damage–such as alligator cracking – in pavements. Overall, the assessment of the pre-condition sites indicates that KYTC may be misusing preventive maintenance by applying to sites that require more extensive rehabilitation or even reconstruction.
Source: University of Kentucky
Authors: Dominic J. Michels