ABSTRACT
The characteristic response of flexible pavements under traffic load depict a delayed lateral strain relaxation (Viscoelasticity), a phenomenon that may be more accurately and expeditiously analysed using finite element (FE) viscoelastic responsemodels. In this study a flexible pavement was modelled using ANSYS/ED finite element software suite.
The pavement model was subjected to cyclic loading that simulated three levels of truck loads on 10R20 tyres at four tyre inflation pressures (viz. 350,490,630 and 770 kPa). The modelled results were in good agreement with the measured in-situ full-scale test data. Therefore, for known pavement material characteristics and tyre-pavement contact regime, finite element method could be used to efficiently estimate the fatigue life of flexible pavement with thin bituminous surfacing layers.
MATERIALS AND METHODS

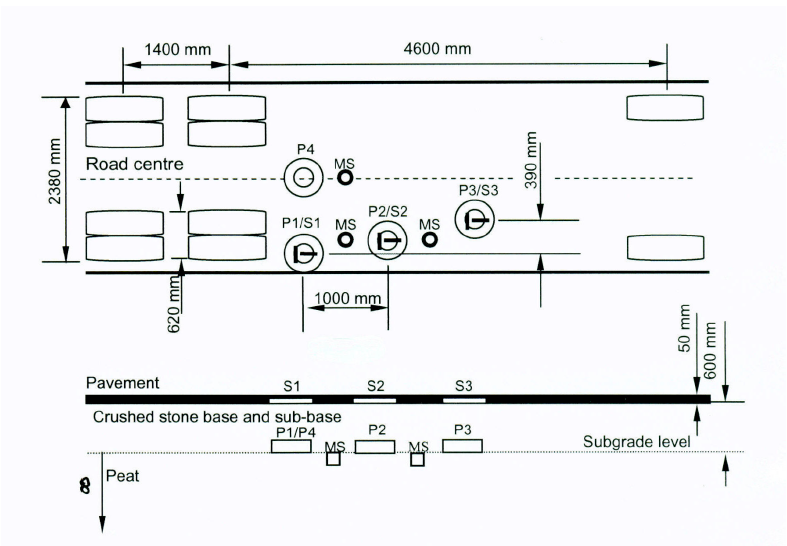
Fig. 2. Schematic of pavement model, positioning of wheel loads and location of sensors including, Strain Transducers (S1, S2, S3), Pressure Cells (P1, P2, P3 and P4), and Moisture Sensors (MS); axle spacing and track width of experimental truck are superimposed.
The pavement model considered in this study consisted of 50 mm of asphalt layer of Dense Base course Macadam (DBM), 200 mm of crushed rock base, and 400 mm of sandy gravel subbase overlaid on a subgrade of peat. Illustration in Fig. 2 depicts the cross-section of the experimental road from which the model verification data was derived. Owende et al., 2001 details the experimental conditions and precautions that were implemented to assure integrity of the in-situ experimental data used in the verification of the finite element model in this study.

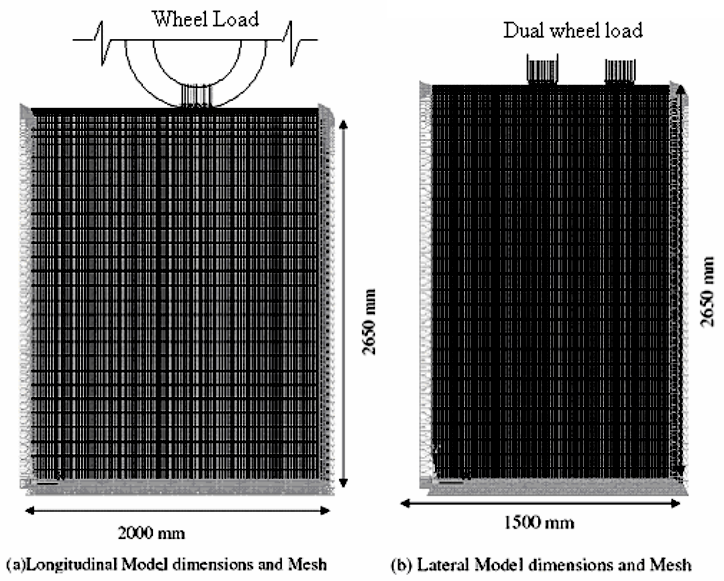
Fig. 3. The Finite Element Mesh showing the physical dimensions and the imposed boundary conditions and load distribution.
PLANE183 elements with viscoelastic capability were used for the non linear viscoelastic model (ANSYS inc, 1999). Considering the symmetry in the truck-pavement interactions, a 2D pavement model under half wheel load of length 1500 mm and 2000 mm in the lateral and longitudinal directions, respectively, and a road profile depth of 2650 mm was considered for analysis. The model pavement structure was then meshed (see Fig. 3).
RESULTS AND DISCUSSION

Fig. 4. Simulated longitudinal strain curve for nodes corresponding to sensor location P1/S1 at the bottom of the bituminous layer corresponding to single front, middle, and rear dual wheel loads of 31.7, 44.6, and 44.1kN.
Fig. 4 shows the predicted pavement strains in the longitudinal direction. The observation indicates that the longitudinal strain shifts from compression (negative values) to tension (positive values) and back to compression with the simulated wheel passes, which was consistent with available evidence (Owende et al., 2001, Huhtala et al., 1990, Douglas, 1999, Siddharthan et al., 1998). The predicted compressive strain before and ahead of the wheel was approximately equal.

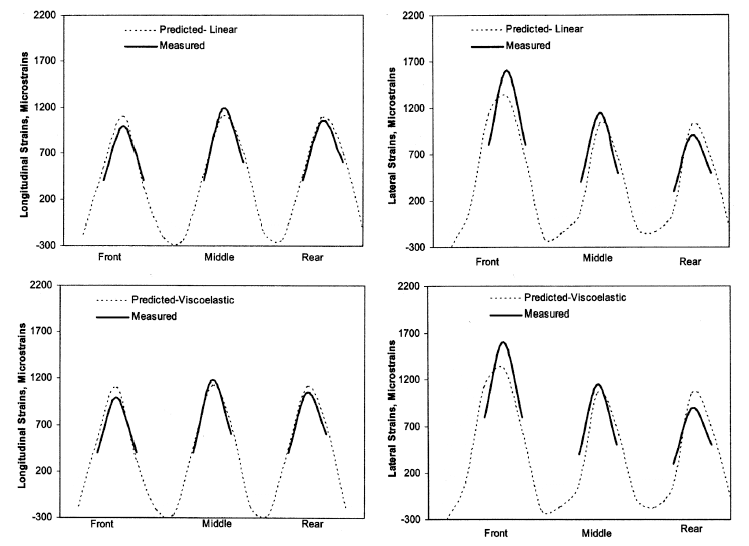
Fig. 6. Individual axle time course for measured and predicted longitudinal and lateral strains corresponding to single front wheel, middle and rear dual wheel loads of 31.7, 44.6 and 44.1 kN, respectively, at tyre inflation pressure of 630 kPa (90 psi). Linear (top) and viscoelastic (bottom) material characteristics of DBM layer are considered.

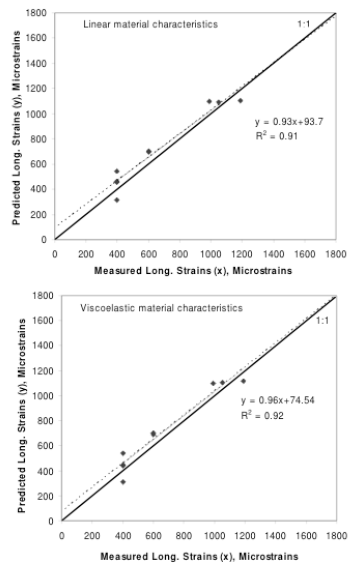
Fig. 7. Correlation between predicted and in-situ measured longitudinal strains corresponding to single front wheel, middle and rear dual wheel loads of 31.7, 44.6 and 44.1 kN, respectively, at tyre inflation pressure of 630 kPa (90 psi). Linear (top) and viscoelastic (bottom) material characteristics of DBM layer are considered.
The individual axle time course of the observed and simulated longitudinal and lateral strains were compared graphically (Fig. 6). It was observed that the peak values of the simulated strains matched well with its in-situ measured strains in both planes, with the longitudinal strains showing a closer fit i.e lower standard error (Table 3). The model over predicted as well as under predicted the strains in some cases for both linear and viscoelastic models.Scatter gram of the observed and simulated strains from the time course showed that the simulated strains were generally over predictive in the longitudinal plane (Fig. 7).
CONCLUSION
It has been shown that for known pavement material characteristics and tyre-pavement contact regime, finite element method could be used to efficiently estimate the strain at the bottom of the bituminous surfacing layers. Such data could be used to assess the expected fatigue performance of model pavements and improve on design characteristics prior to construction.
Source: ITB
Authors: R.M. Mulungye | P.M.O Owende | K. Mellon